Public Preview: NetBox Analytics Puts Your Infrastructure Record to Work
Infrastructure teams answer the same handful of questions every planning cycle. How full is our IP space? Which racks are near power limits? What hardware is aging and due for refresh? Where does the next dollar of capacity go?
Your team already models the data those answers come from, and keeps it current. That model is the asset. NetBox Analytics is now in public preview, and it is the reporting layer that reads it: more than ten pre-built dashboards on the SaaS edition of the NetBox Labs Infrastructure Intelligence Platform, with more on the way.
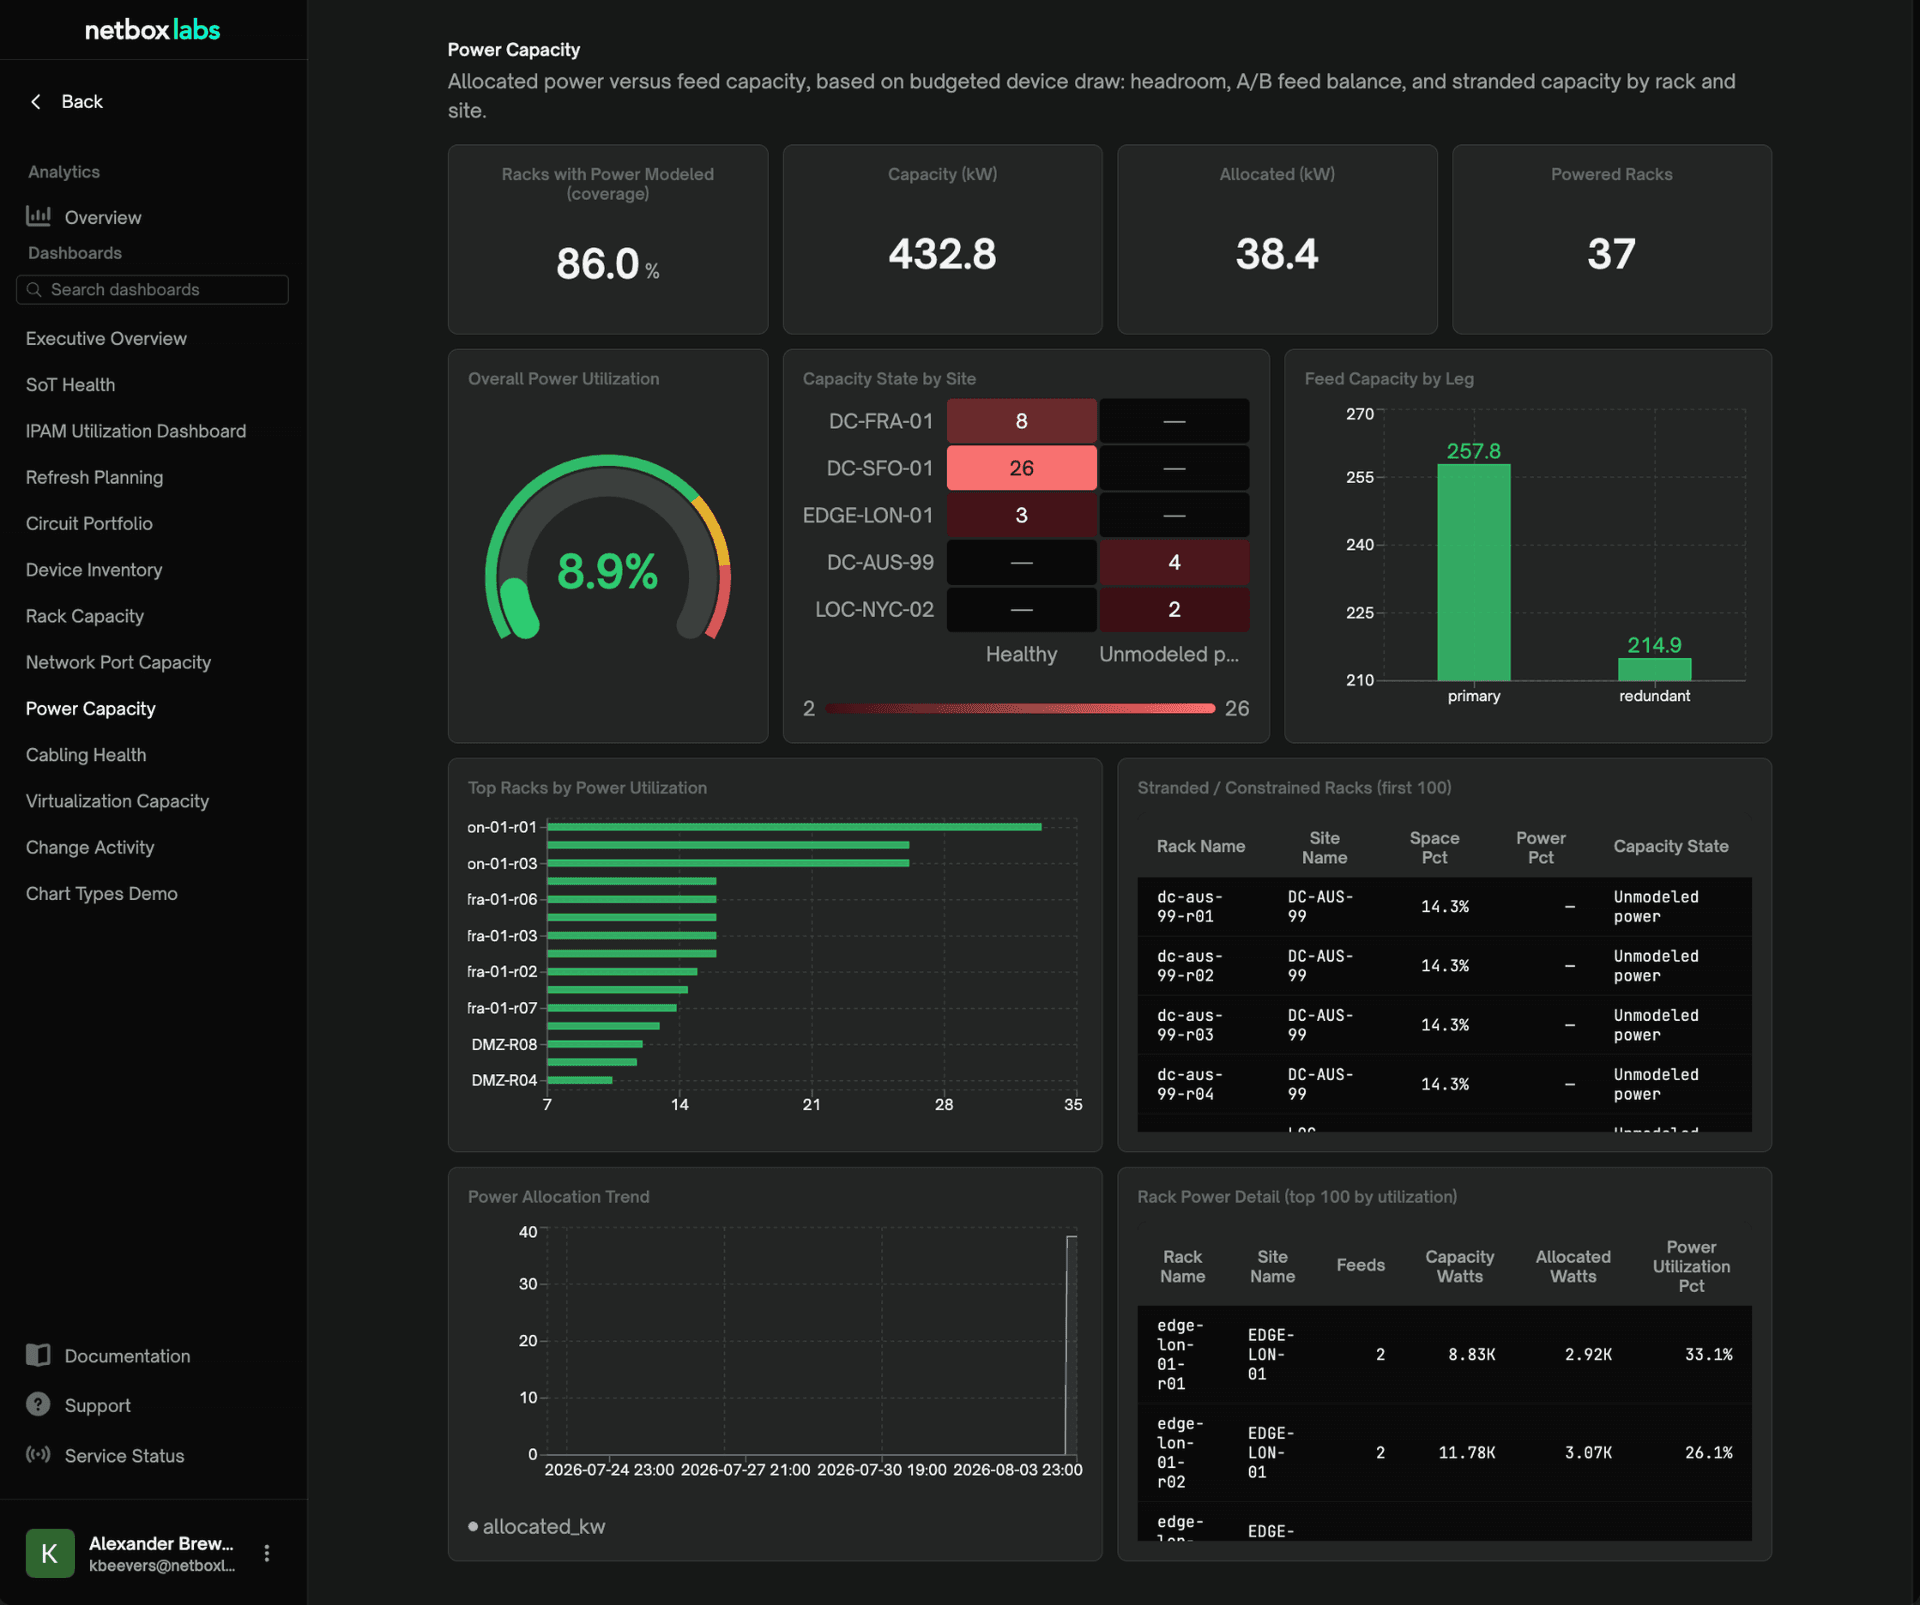
Power Capacity Dashboard
Why we’re building this
Customers have been drawing real value out of the infrastructure data in NetBox for years, through custom reports, BI dashboards, and spreadsheets built by engineers who know their own infrastructure best. That work told us something useful: the same views come up almost everywhere.
So we built them, and we’ll maintain them. The common questions get a standing answer, and your team’s time goes to the questions that are specific to your environment.
What’s in the preview
Dashboards for the questions that come up most
- Executive. Executive Overview puts capacity, utilization, data quality, and change activity for every site on a single screen.
- Data health. System of Record Health scores how much of your infrastructure is actually modeled, breaks coverage down by domain, and hands you a prioritized worklist.
- Capacity and utilization. Rack Capacity, Power Capacity, Network Port Capacity, and IPAM Utilization show where your headroom is, where it is going, and which sites reach a limit first, with worst-first detail tables.
- Inventory and lifecycle. Device Inventory and Refresh Planning cover fleet composition, age mix, metadata quality, and forward-looking refresh waves by quarter, site, and role.
- Network services. Circuit Portfolio, Cabling Health, and Virtualization Capacity cover provider exposure and redundancy risk, cable plant documentation coverage, and cluster or VM allocation.
Every dashboard carries interactive filters so you can narrow any view by site, role, manufacturer, provider, user, and more.
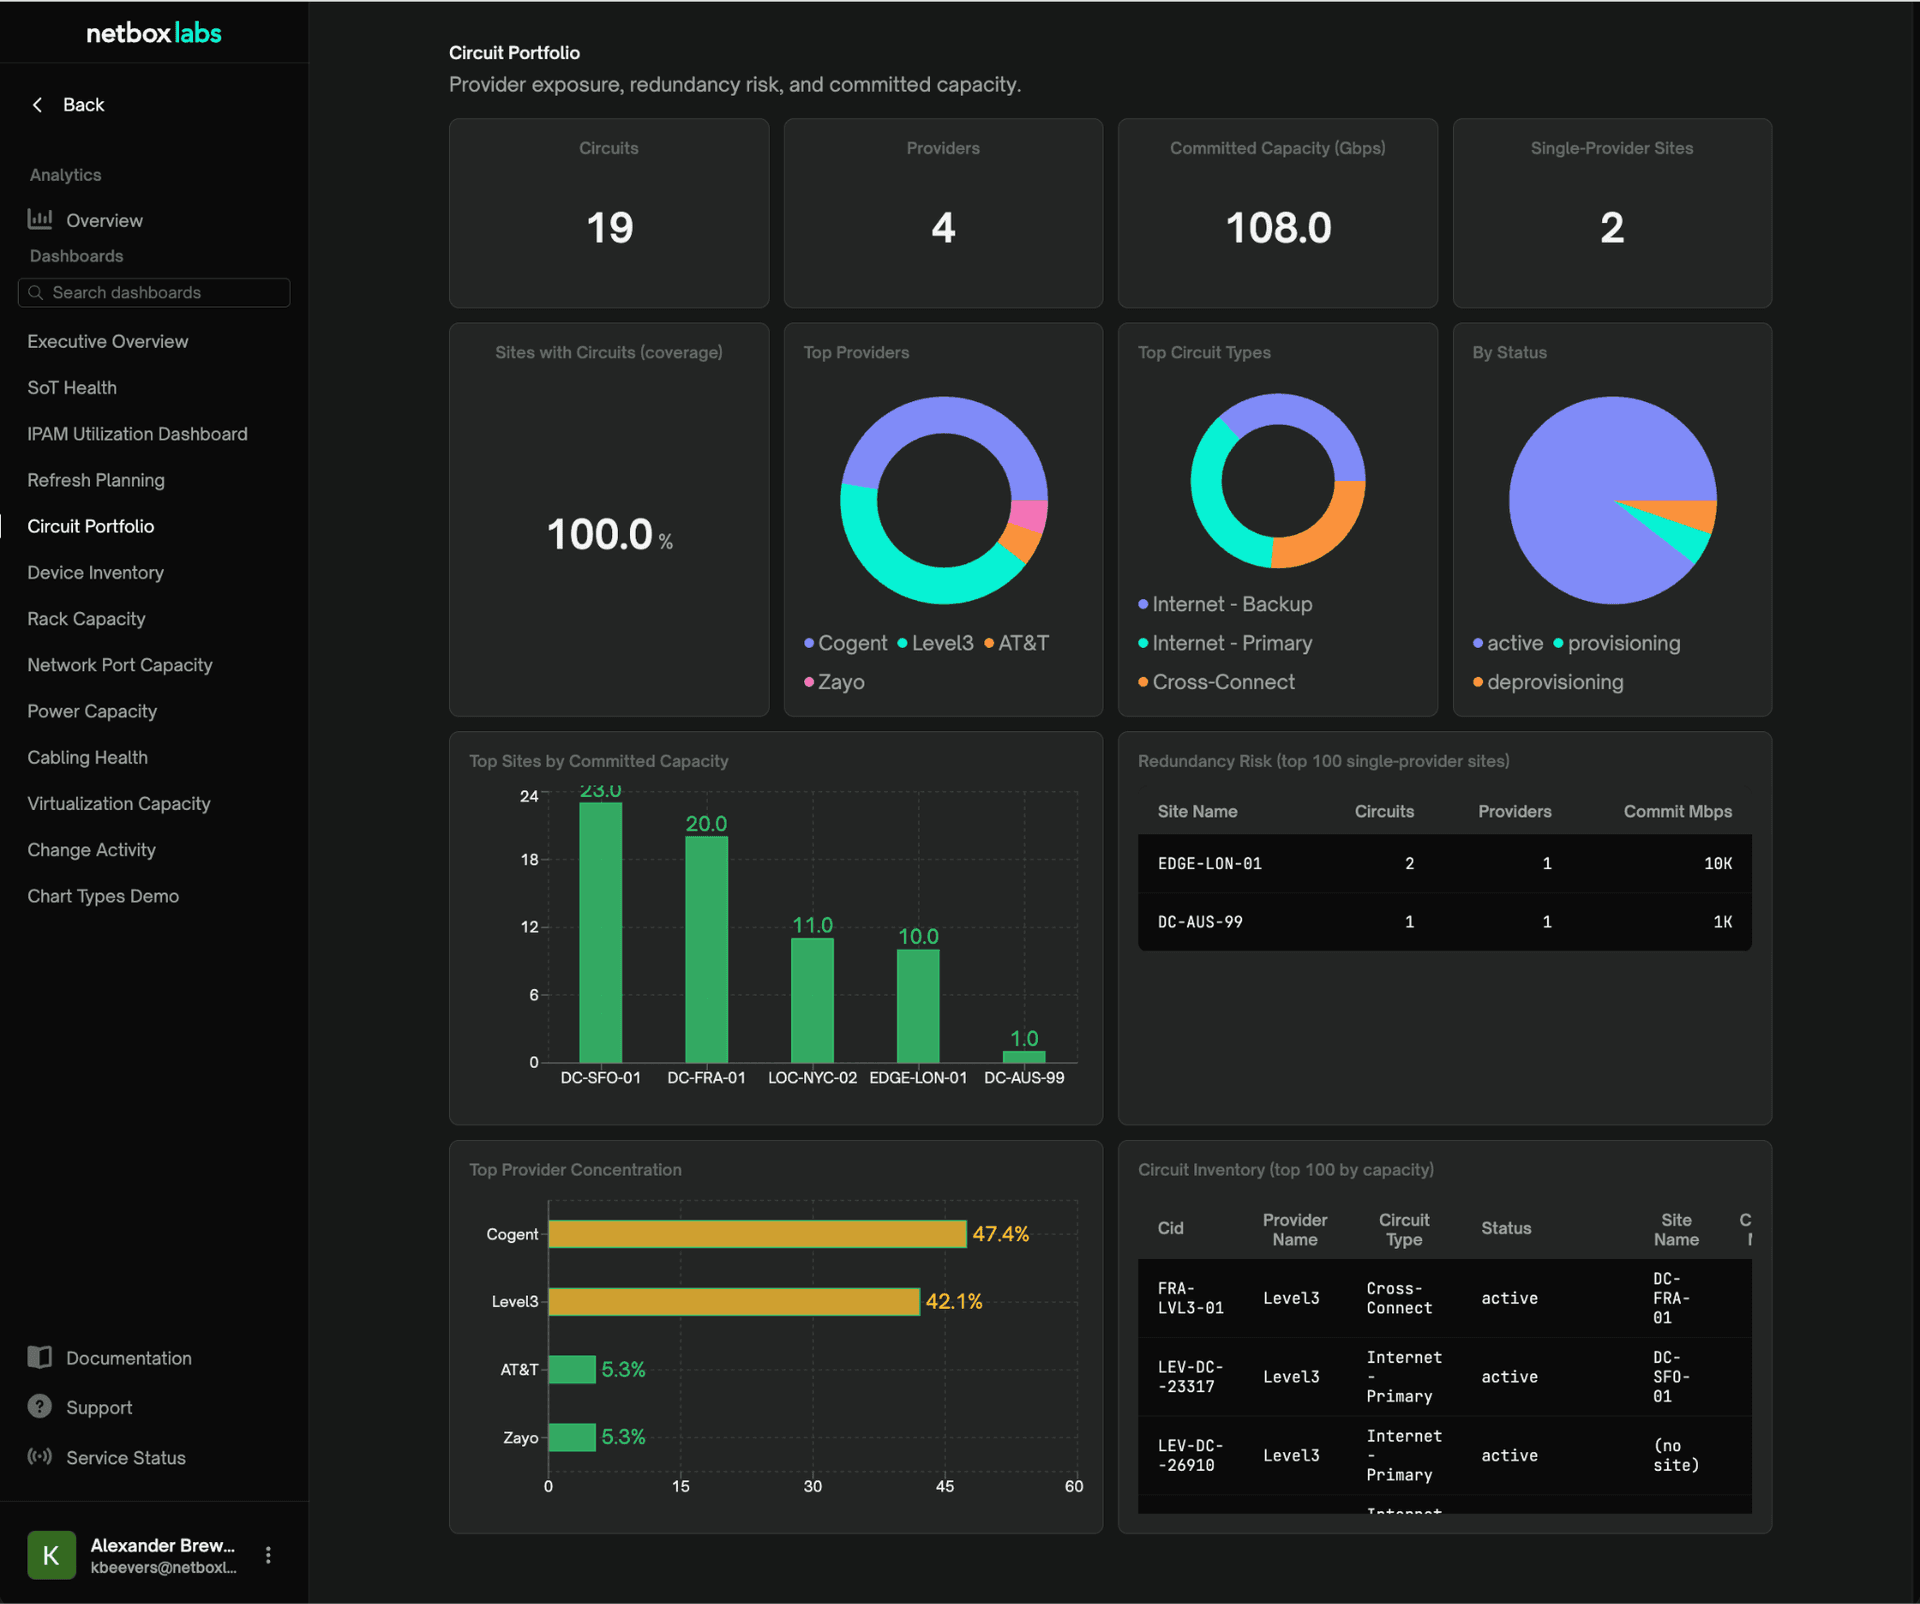
Circuit Portfolio Dashboard
Your data quality, scored
Every panel tells you how much of the picture it actually has. If your racks do not carry power draw values, the power panel reports that coverage instead of inventing a number.
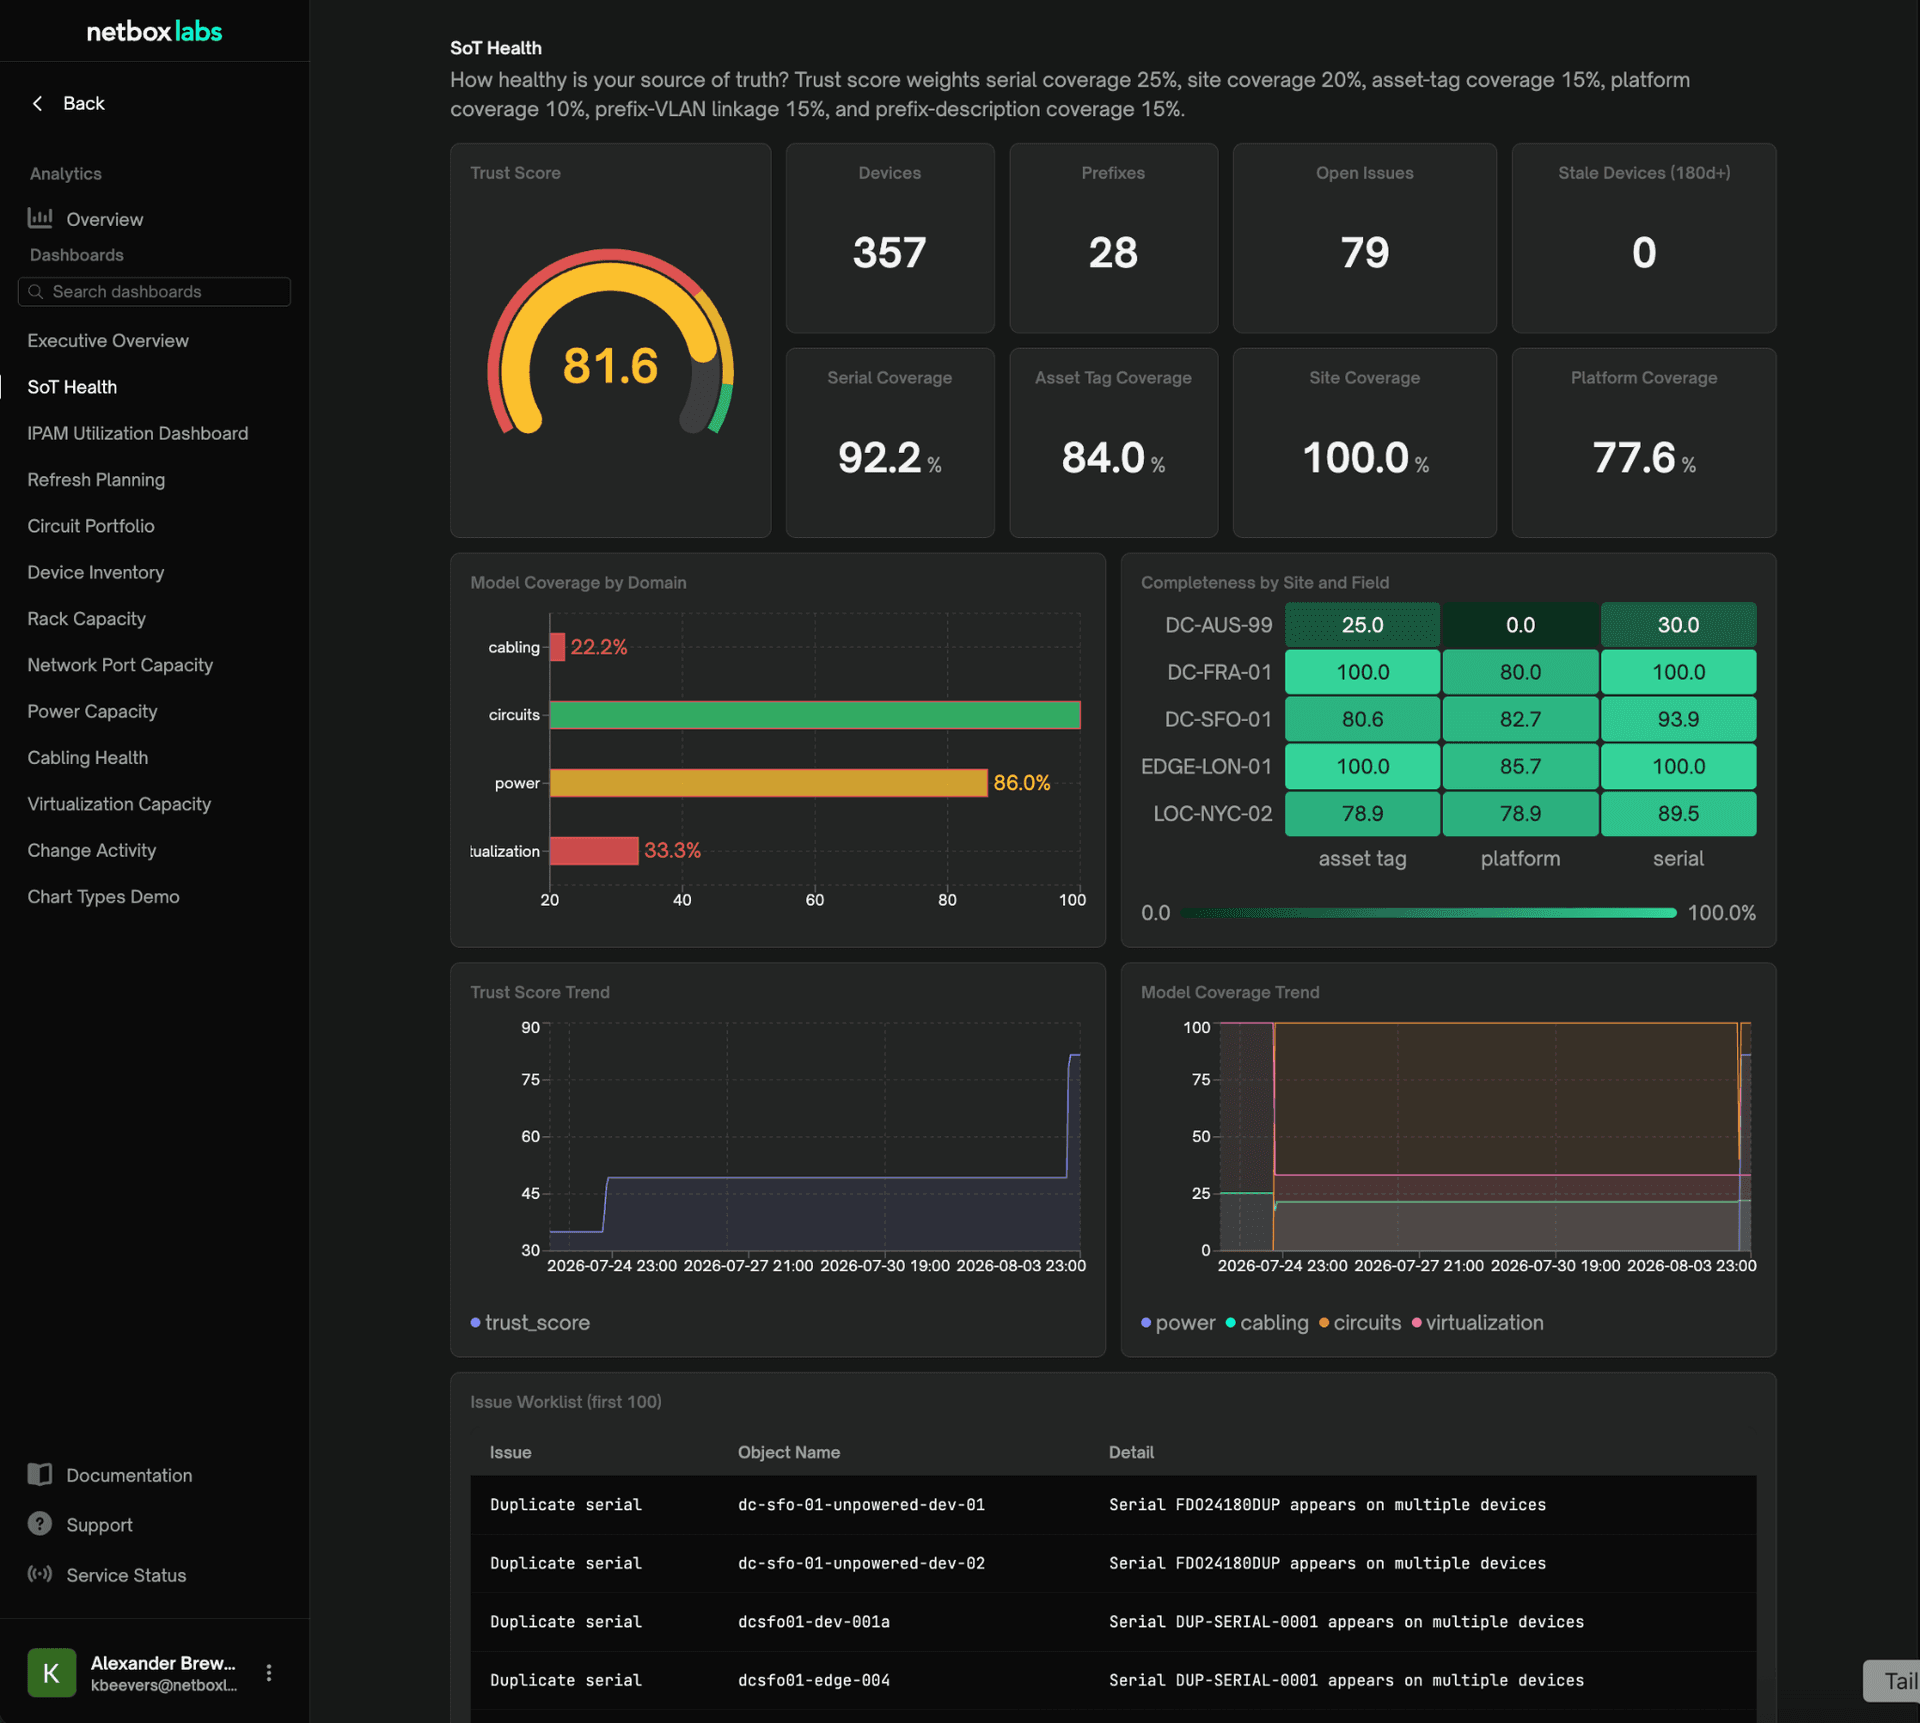
System of Record Health Dashboard
That is what the System of Record Health dashboard is for. It scores your data, breaks coverage down by domain, and hands you a worklist in priority order, so thin data stops being the reason to wait and becomes the reason to start. Teams already running a hygiene effort get a scoreboard for it, and every point of coverage they win unlocks more insights.
Current within minutes, with trending from day one
Changes in your NetBox data stream continuously into the analytics layer, so dashboards reflect your record within minutes and stay in step with it on their own. Historical trending is included, and it begins accumulating the day Analytics is switched on.
Where Analytics goes next
NetBox Analytics has already undergone quick expansion and refinement with feedback from customers. Feedback we get during the public preview will directly shape the product, which will GA later this year. Expect the initial dashboard set to evolve over time, and telling us which panels you live in, which ones are distractions, and what’s missing will influence product changes.
How to get hands-on
Analytics is available on request during the public preview to any customer on the SaaS edition running NetBox 4.5 or later. It runs on the SaaS edition only, and it is not planned for the self-managed edition. Reach out to your account executive or customer success manager to have it enabled, and they will connect you with the product team so your feedback reaches the people building the catalog. The documentation covers each dashboard and the data behind it.
Analytics is a commercial capability. During the preview it is available on request. At general availability it will be tiered, and not every dashboard will be in every tier, with final packaging confirmed then.
Not on the SaaS edition yet? Request a demo and we will walk through Analytics alongside the rest of the platform.