NetBox Analytics
NetBox Analytics is a set of pre-built, interactive dashboards that answer capacity, utilization, and lifecycle questions directly from the data in your NetBox. Dashboards live inside the NetBox Labs platform console, stay current as your NetBox changes, and require no setup: no scripts to write, no exports to schedule, no reporting pipeline to build or maintain.
Public Preview - NetBox Analytics is available now for NetBox Cloud customers running NetBox 4.5 or later, with tiered access to the dashboard catalog. Contact your account team to enable it for your instance. General availability is planned for later this year.
How it works
Analytics reads the infrastructure record you already maintain in NetBox. When your team updates NetBox - adding devices, allocating prefixes, documenting cables - the dashboards reflect those changes within minutes, automatically. There is nothing to configure and nothing to keep in sync, and your data remains fully isolated from every other customer's.
Because analytics reads your system of record rather than the live network, it answers a different set of questions than monitoring and observability tools: not "what is the network doing right now," but what do we have, how full is it, what is aging, and what changed. The two are complementary - most teams run both.
The dashboard catalog
Analytics ships as a curated catalog of dashboards, organized around the questions infrastructure teams are most often asked. The catalog grows over time - new dashboards appear as they are released, without any action on your part - so the categories below describe the kinds of questions covered rather than a fixed list.
| Category | Questions it answers |
|---|---|
| Executive reporting | How is the whole estate doing? One-screen rollups of capacity, utilization, data quality, and change activity across every site - the view for a QBR or budget review. |
| Data health | How complete and trustworthy is our infrastructure record, and what should we fix first? |
| Capacity and utilization | How full is our IP space? Which racks are near their power limits? Which sites run out of ports, space, or watts first? |
| Inventory and lifecycle | What do we run, where, and how old is it? What should the next hardware refresh cover, and when? |
| Network services | Where are we exposed to a single provider? How complete is our cable documentation? How is virtualization capacity allocated? |
| Audit | Who changed what, and when? How much change is happening, by whom, and at what hours? |
Individual dashboards, panels, and layouts evolve as the catalog matures. If there is an analytics view your team needs and doesn't see, tell your account team - customer requests directly shape what gets built.
Good data makes good analytics
Analytics can only report on what you model. If power feeds aren't documented in NetBox, power dashboards have nothing to show; if devices are missing serial numbers, inventory views are incomplete. This isn't a limitation to work around - it's the most useful signal analytics gives you, and there is a dashboard dedicated to it.
System of Record Health (SoR Health) scores the completeness of your infrastructure record and shows you exactly where it's strong and where it's thin:
- A trust score summarizing the overall completeness of your record
- Coverage by domain, showing which parts of your infrastructure are well modeled and which aren't
- A prioritized worklist of specific data-quality issues - missing fields, duplicates, stale records - naming the exact objects to fix
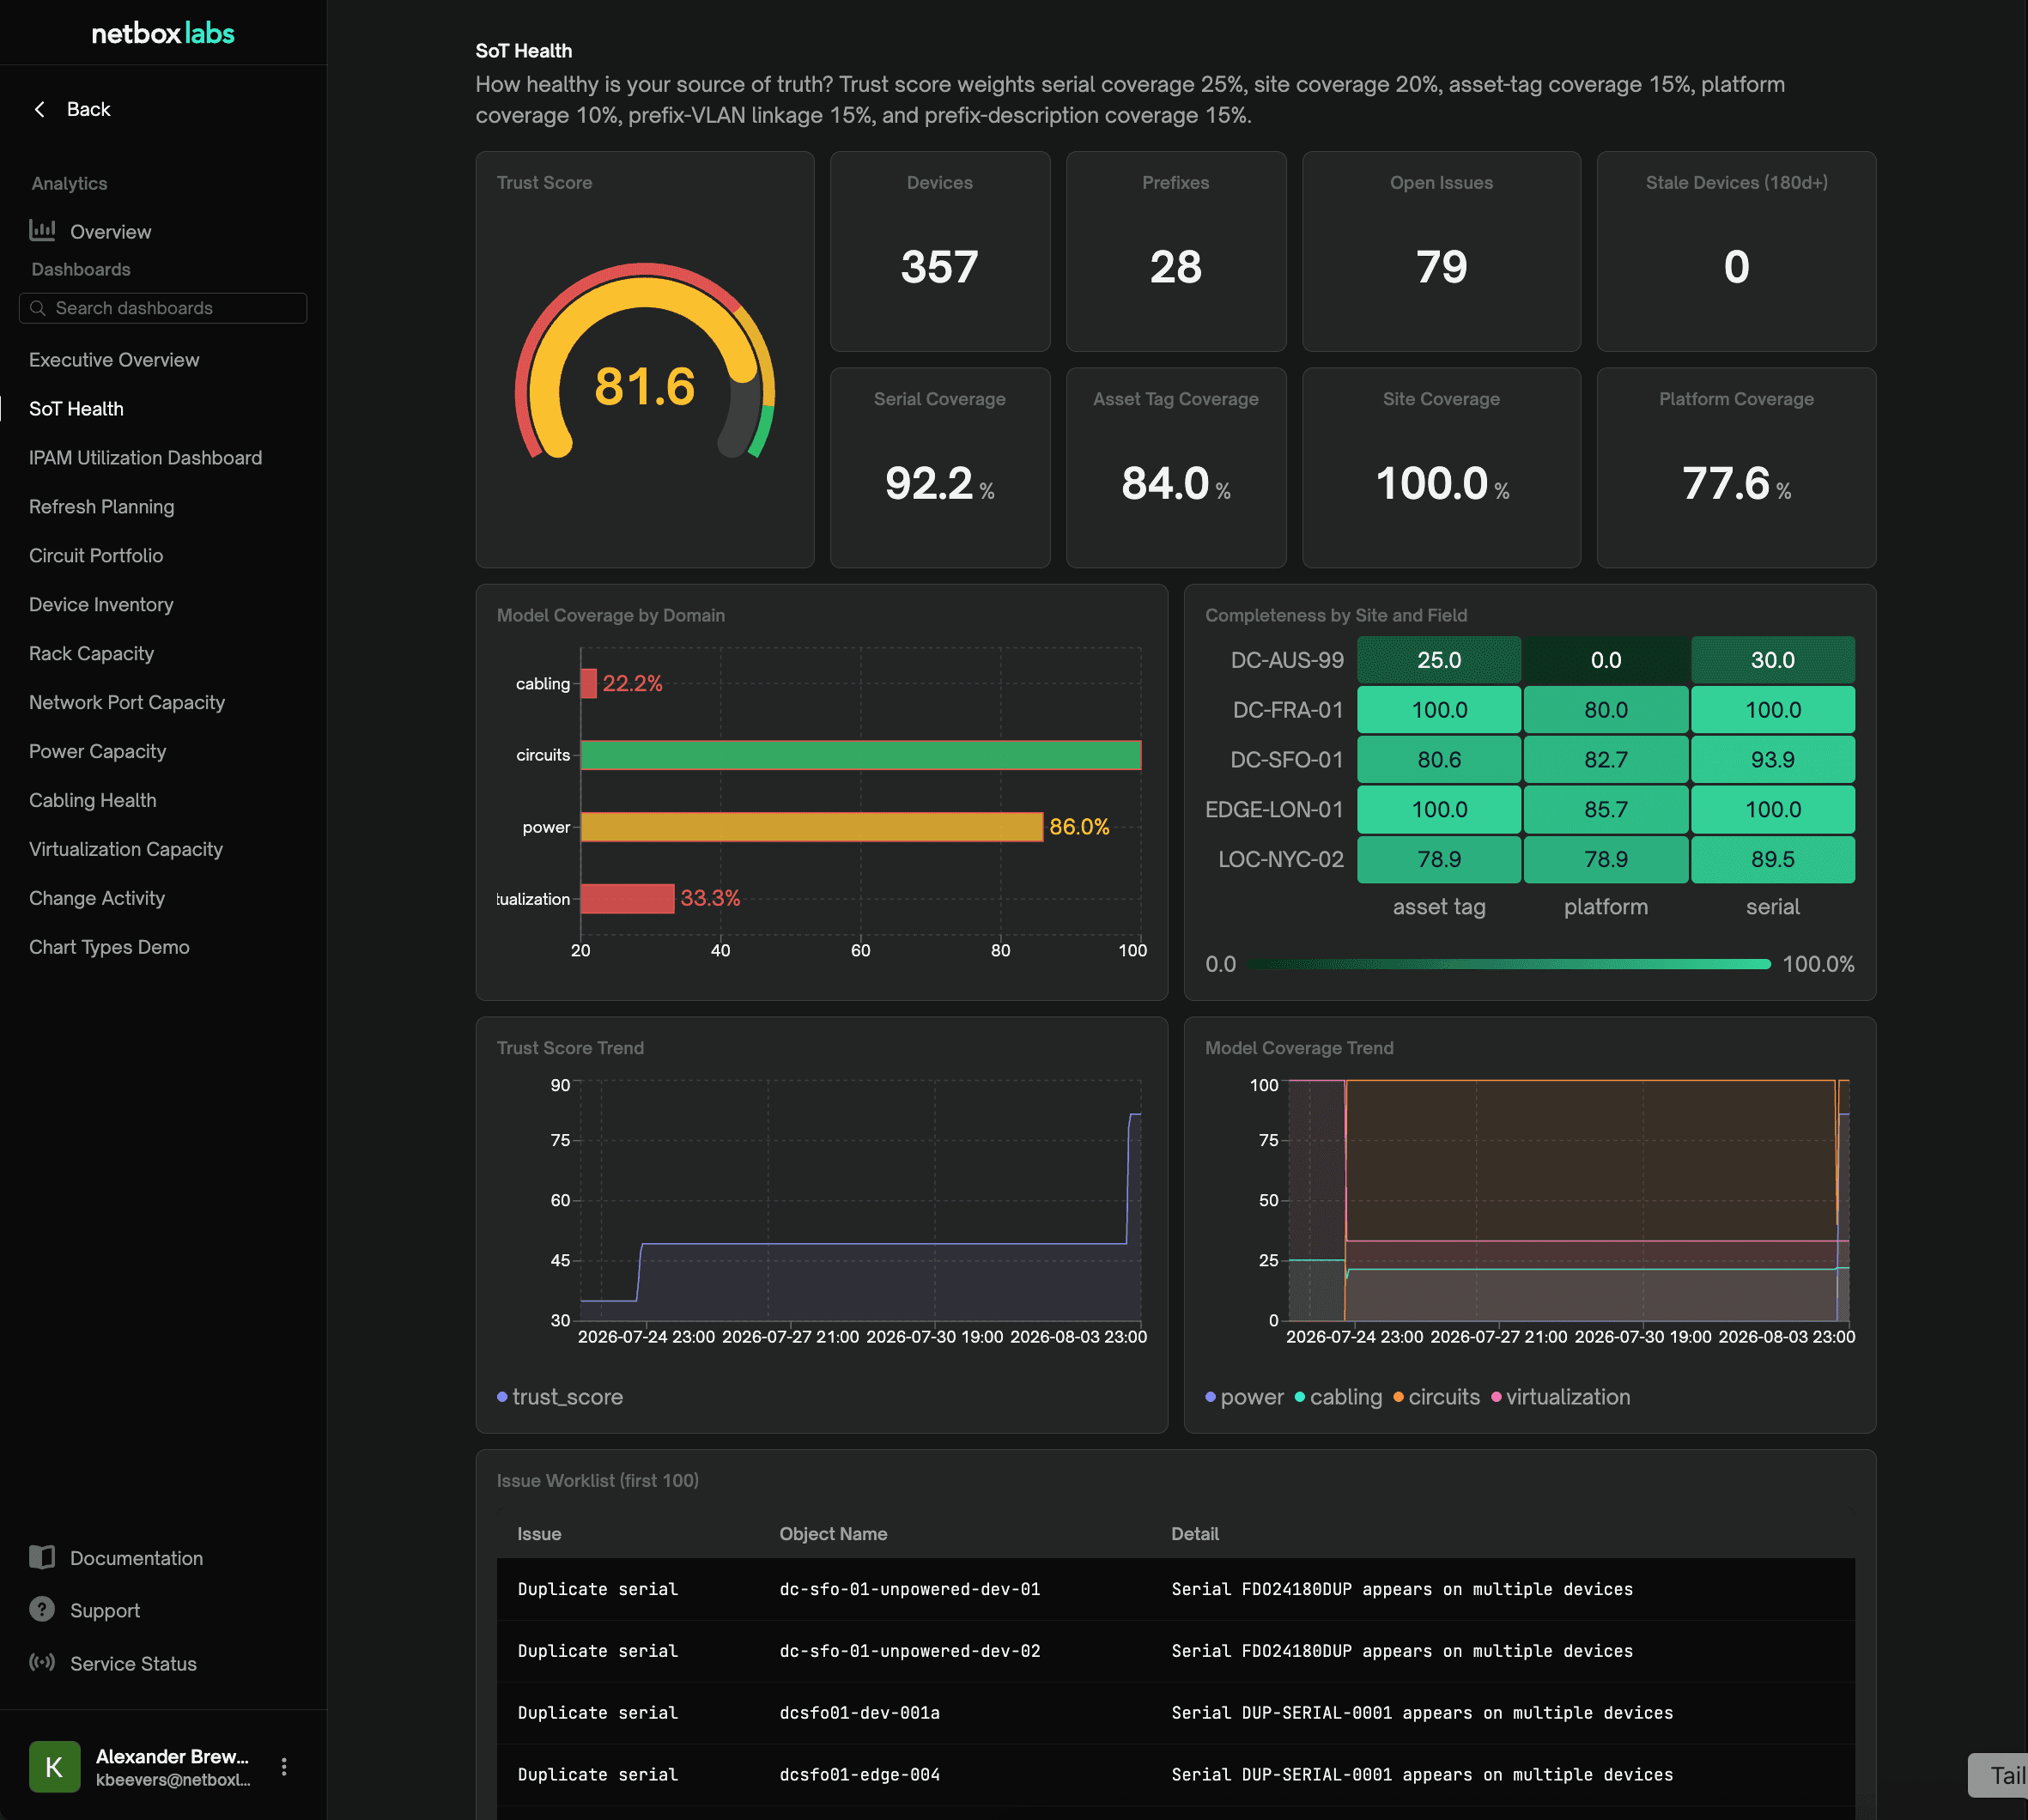
We recommend making SoR Health your first stop, and returning to it regularly:
- Check the score and coverage to see where your record stands today.
- Work the list. The worklist is ordered so your team can burn it down item by item; each fix is a concrete edit in NetBox.
- Watch everything improve. As coverage rises, the rest of the catalog fills in - better power modeling lights up power analytics, complete serials sharpen inventory views, and the trust score tracks your progress over time.
Teams that treat data quality as a measurable, ongoing practice get the most from analytics - and from NetBox itself. SoR Health is the scoreboard for that practice.
Using dashboards
Filters. Every dashboard carries filters relevant to its data - site, role, manufacturer, provider, user, and others depending on the dashboard. Filter values come from your own data, filters can be combined, and multiple values can be selected at once. Choose your selections and apply them to narrow every panel on the dashboard at once - for example, scoping an executive rollup to one region, or an inventory view to a single manufacturer.
Detail tables. Dashboards pair their charts with detail tables sorted so the most actionable rows come first - the most constrained sites, the most utilized prefixes, the oldest hardware. When a chart prompts "which ones, exactly?", the answer is in the table below it.
Trends. Trend panels accumulate history from the day analytics is enabled on your instance. There is no retroactive backfill - a newly enabled instance shows trend lines that begin at enablement and grow richer by the day. Give trends a week or two before drawing conclusions from them.
What to expect
- Freshness. Dashboards reflect changes to your NetBox within minutes. If you make an edit and refresh a dashboard right away, allow a few minutes for the change to appear.
- Rendering. Dashboards typically load in a few seconds. Very large estates may take a little longer on data-dense panels.
- Sparse or empty panels almost always mean the underlying domain isn't modeled in your NetBox yet - not that something is broken. Check SoR Health's coverage view to see which domains have data, and to get the worklist for filling the gaps.
- Numbers reflect your record. Analytics totals match what's in NetBox, not what a live-network tool observes. If the two disagree, that gap itself is useful: it usually means the record needs updating.
- The catalog changes. Dashboards are added and improved on an ongoing basis. Layouts and panels may evolve without notice.
FAQ
Why is a panel empty? The domain it reads isn't modeled in your NetBox yet - for example, power panels stay empty until power feeds are documented. SoR Health shows your coverage by domain and lists what to add.
Why don't these numbers match my monitoring tool? They measure different things. Monitoring reads the live network; analytics reads your system of record. Disagreement between the two usually points to records that need updating - which is exactly what a source of truth is for.
Can I build my own dashboards? No - analytics is a curated catalog rather than a dashboard-authoring tool. The catalog expands based on what customers ask for, so if you need a view that doesn't exist, tell your account team what you'd build.
Can I get the underlying data into my own BI tools? Analytics is delivered as dashboards in the platform console; a direct data feed isn't part of the product today. If your team needs one, let your account team know.
Which NetBox versions are supported? NetBox Analytics requires NetBox 4.5 or later on NetBox Cloud.
How do I request a dashboard or report an issue? Through your account team or NetBox Labs support. Dashboard requests are genuinely welcome - they steer the catalog.