NetBox Analytics: Get Insight from Your System of Record without Manual Effort

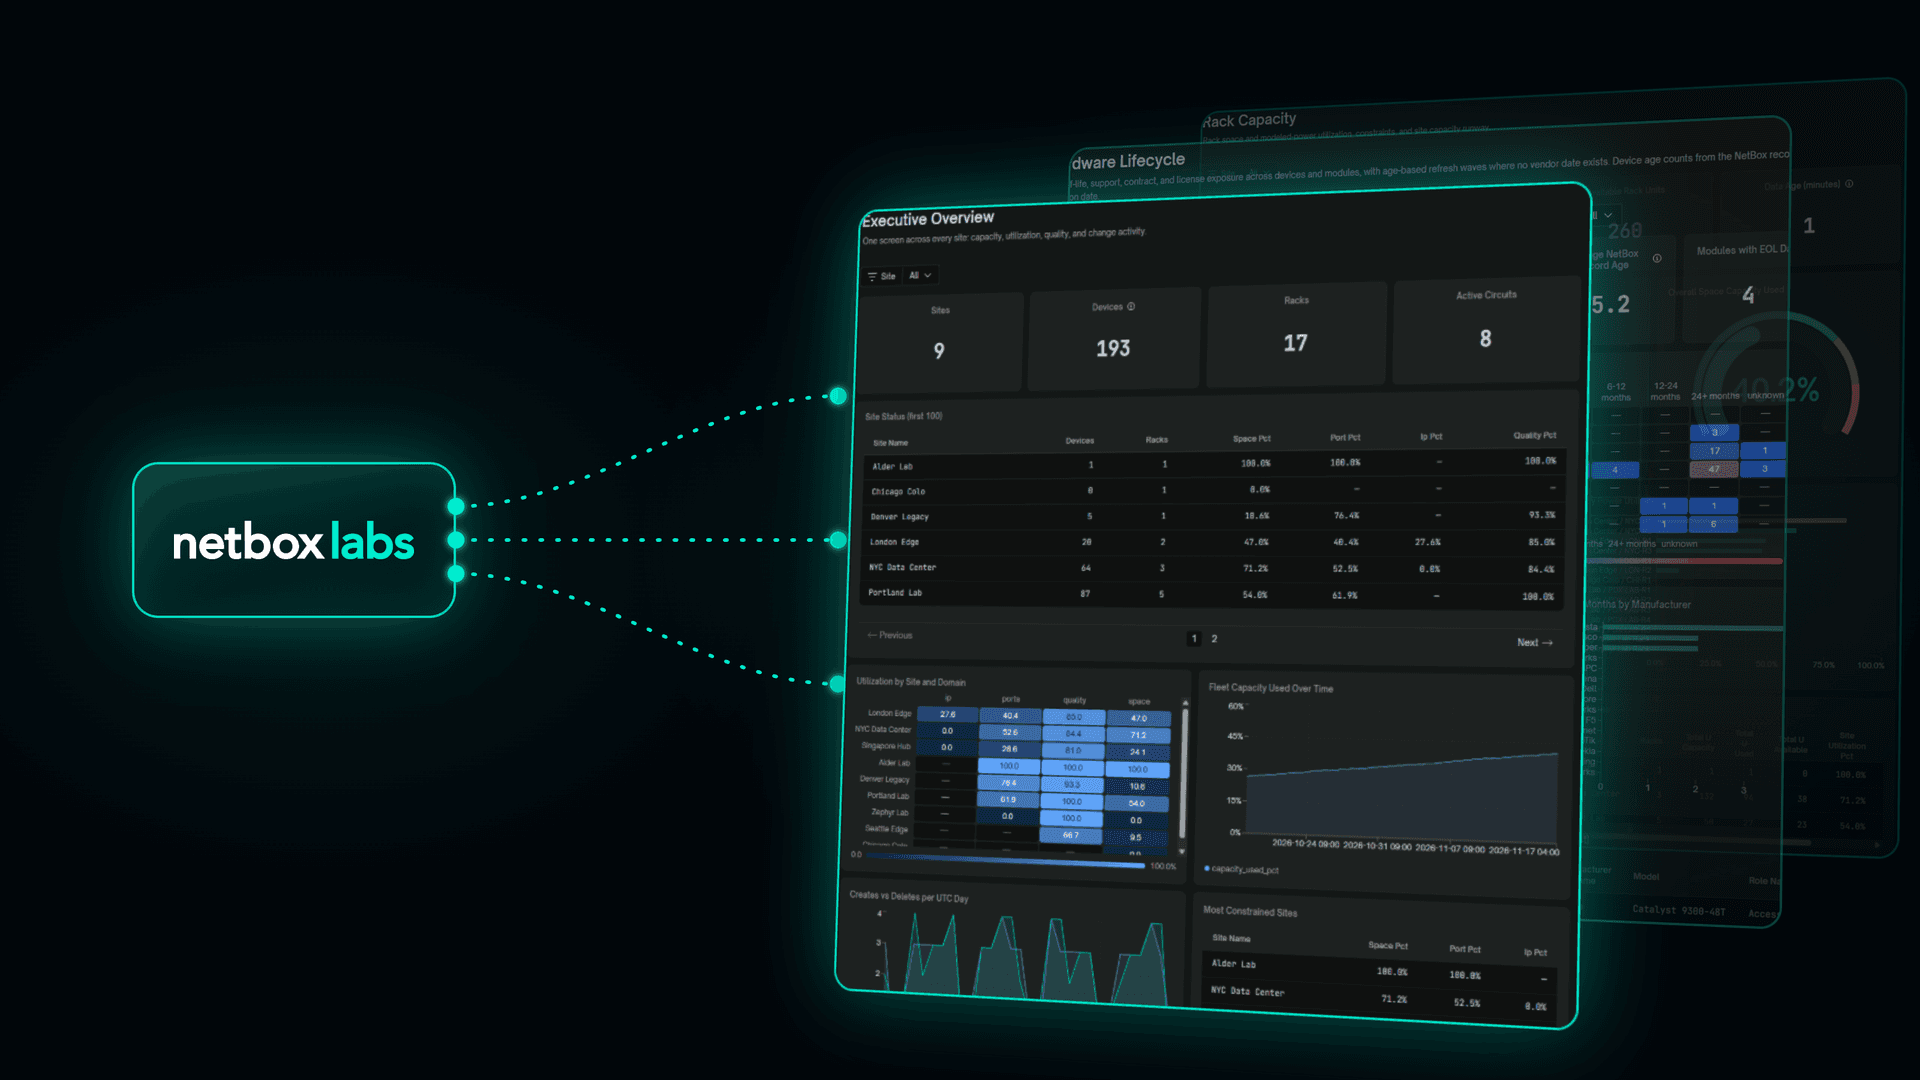
Generally available today, NetBox Analytics delivers pre-built dashboards that show how full your IP space, racks, power, and ports are, and what hardware is due for refresh.
Your system of record already holds the data behind your biggest capacity, utilization, and lifecycle questions. Rolling that data up across sites and tracking it over time is a reporting job, and until now that job meant one-off scripts and spreadsheet exports.
NetBox Analytics, generally available today, takes it off your team’s plate with pre-built dashboards for the questions you’re asked most. NetBox Labs runs and maintains the analytics pipeline and warehouse that power these dashboards, so there’s no ETL to build, nothing to keep in sync, and changes show up within minutes.
The NetBox Analytics dashboard catalog
The catalog groups 16 dashboards by how teams use them. The Essentials bundle includes eight single-domain dashboards for engineers’ day-to-day work:
- System of Record Health: Gives your record a trust score, with field completeness, model coverage by domain, and a prioritized data-quality worklist.
- IPAM Utilization: Breaks utilization down by prefix, VRF, tenant, and site, shows fragmentation, and flags the prefixes nearing exhaustion.
- Network Port Capacity: Shows port utilization and speed distribution across sites and flags where capacity is constrained.
- Rack Capacity: Shows rack unit and weight utilization by site, worst first, across owned and colo facilities.
- Cabling Health: Shows how much of the cable plant is documented,site by site.
- L2/L3 Services: Covers services, VLANs, VRFs, and FHRP groups, including FHRP redundancy, exposed services and ports, ASN coverage, and circuit group failover.
- Audit Evidence: Shows who changed what and when over the last 90 days of the changelog, with change velocity, actors, and field-level change details.
- Device Inventory: Covers fleet composition, age mix, and metadata quality

The Complete bundle adds eight cross-domain views that managers use to plan the next quarter or year:
- Executive Overview: Puts capacity, utilization, data quality, and change activity for every site on one screen.
- Hardware Lifecycle: Shows end-of-life, support, contract, and license exposure with refresh waves, using NDX end-of-life dates when NDX is installed and the record’s age when it isn’t.
- Power Capacity: Shows power utilization by site and rack, with the sites closest to their limit first.
- Circuit Portfolio: Shows provider exposure and redundancy risk across the circuit estate.
- Virtualization Capacity: Shows cluster and VM allocation across the estate.
- Tenant Scorecard: Shows how much of the estate carries a tenant, and what each tenant uses across sites, racks, devices, IP space, circuits, and VMs.
- Change Governance: Covers branches, change requests, reviewers, lead time to merge, and changes made outside the review process. It appears for customers who run the Branching and Changes plugins.
- Spares & Procurement: Shows spares pools and cover against the installed fleet, purchase orders, lead times, shipments, and vendors. It appears for customers who run the Asset Lifecycle plugin.
Based on feedback from customers, GA brings the catalog to 16 dashboards by adding four to the 12 that shipped in public preview: L2/L3 Services and Tenant Scorecard, as well as Change Governance and Spares & Procurement for users with the necessary plugins. It also enhances and renames two preview dashboards: Refresh Planning is now Hardware Lifecycle, and Change Activity is now Audit Evidence, which adds field-level change details.

How NetBox Analytics works with your system of record
NetBox Analytics runs in the NetBox Cloud console beside your instance and reads the record your team already maintains, so there’s nothing new to build or keep in sync.
NetBox Analytics:
- Stays current without a sync job. Every change in your system of record reaches the dashboards within minutes, so there’s no export to go stale and no second copy to reconcile.
- Builds history from day one. Your system of record describes what you have now. NetBox Analytics adds how that changes over time, recording trends from the day it’s enabled.
- Filters the way you slice your infrastructure. Every dashboard has interactive filters such as site, role, manufacturer, provider, and user.
- Keeps your data isolated. Each customer’s data is kept separate from every other tenant’s.
- Turns thin data into a worklist. If parts of your model are sparse, the System of Record Health dashboard shows which gaps matter most and in what order, so a sparse model becomes a place to start.
How NetBox Analytics fits with your BI tools
If you’ve already wired your NetBox data into Grafana, Tableau, or Power BI, you know the cost: ETL to maintain, schema changes on every upgrade, and API load on your instance. An AI agent can now generate a dashboard from a snapshot of API responses in an afternoon, but it can’t build or maintain the continuous ingest, materialized views, and trend history underneath. NetBox Analytics runs that stack for you, and the dashboards are the first view into it.
The catalog is curated, so there’s no self-service dashboard builder. Teams that want to build their own Grafana views can use the free NetBox Data Source for Grafana, and the two work side by side. It also complements observability tools. Datadog, Kentik, and similar platforms read the wire to show what your network is doing right now. Analytics reads the record to show what you have, how full it is, and what’s aging.

What NetBox Analytics means for engineers and infrastructure leaders
For infrastructure engineers, IP space is the natural place to start. The IPAM Utilization dashboard answers “how full is our IP space?” on demand. After that, capacity and lifecycle questions take minutes to answer instead of turning into a pipeline project someone has to own, and the numbers an engineer brings to a planning meeting match the record.
For infrastructure directors and VPs as well as CIOs, the payoff is faster answers without adding headcount or paying for BI tooling. Capacity and risk views support budget requests, and the decisions they inform rest on the record the organization already trusts.
Both groups work from the same data. An engineer can drill into a single site’s racks or prefixes while a leader reviews capacity rolled up by site and region, and the figures agree because they come from one source. Rack, power, port, and lifecycle views map directly to decisions about where to invest in capacity, when to refresh hardware, and what to procure next.
Get started with NetBox Analytics
NetBox Analytics is available as an add-on for NetBox Cloud, an enterprise-grade SaaS version of the NetBox Labs platform, and requires NetBox 4.5 or later. See what the new product can do for you by answering the questions that cost you the most time today. Contact us for a demo or review the documentation to learn more.
