Announcing NetBox Observability: Infrastructure Monitoring That Understands Your Design
Modern infrastructure monitoring has a fundamental problem: it’s blind to design context.
Your monitoring tools collect metrics and generate alerts, but they don’t understand your infrastructure’s topology, business relationships, or intended architecture. When something breaks, you’re left correlating data across multiple tools, trying to piece together what actually matters.
This is a big problem. And we’re solving it.
Today we’re excited to announce NetBox Observability – a new network and infrastructure monitoring solution launching next year that enriches every metric, alert, and dashboard with NetBox design context.
This changes everything about how you respond to incidents and understand your infrastructure.
The Problem: Monitoring Without Context
Here’s what’s broken about monitoring today:
Your alerts don’t tell you what matters. A device goes down. Your monitoring system fires an alert. But it doesn’t know which services depend on that device, whether redundancy exists, who owns it, or what the business impact is.
During an outage, a single infrastructure failure generates hundreds of alerts – all marked urgent, none providing the context you need to understand what actually broke.
Your dashboards don’t match how you think. Monitoring tools organize metrics by device lists. You organize your infrastructure by sites, by services, by business units. Every time things change, you’re manually rebuilding dashboard groups to match.
You’re switching tools constantly. Alert fires. Check monitoring dashboard. Open NetBox for topology. Pull up documentation. Ask someone what services are affected. Jump back to monitoring to see metrics.
What should take minutes takes hours because of siloed, disconnected data.
The fundamental issue: monitoring tools treat your infrastructure as a collection of independent components. They don’t understand it as a designed architecture where relationships and context determine what actually matters.
The Solution: Monitoring That Knows Your Infrastructure
NetBox Observability makes NetBox the foundation of your monitoring strategy.
Every device, interface, rack, and tenant you’ve documented in NetBox becomes intelligent monitoring – automatically enriched with the topology, relationships, and semantic business context your alerts are missing today.
This isn’t another tool that needs integration with your documentation. It’s monitoring built from the ground up to understand design intent, automatically leveraging the knowledge you’ve already captured in NetBox.
The result: alerts that tell you what actually matters, dashboards organized the way you think, and incident response that doesn’t require jumping between six different tools.
How It Works
NetBox Observability is built on open standards and proven technology.
NetBox drives everything. NetBox serves as your dynamic monitoring inventory source, determining what gets monitored and how. More importantly, NetBox context flows through every layer – enriching alerts, organizing dashboards, and providing the intelligence that transforms metrics into insights.
Battle-tested technology. Built on Orb for agent orchestration and management, the same proven infrastructure that powers NetBox Discovery and refined over nearly a decade at global scale.
Single agent for everything. Deploy lightweight Orb agents that handle both discovery and observability. No separate agent fleets to manage. These agents are designed for highly segmented environments where traditional monitoring tools struggle. They use streaming algorithms to distill signal from noise at the edge – meaning your observability costs scale with insights, not traffic volume.
Multi-protocol data collection. Monitor network devices via SNMP (v2c and v3), receive SNMP traps for real-time events, collect logs and application metrics through OpenTelemetry. For deeper network visibility, pktvisor provides flow analysis and deep packet inspection.
Open standards foundation. The entire NetBox Observability suite is built on OpenTelemetry Protocol (OTLP) – the CNCF standard for observability. This means you’re not locked into proprietary formats. It works with industry-standard components today and adapts to your evolving stack tomorrow.
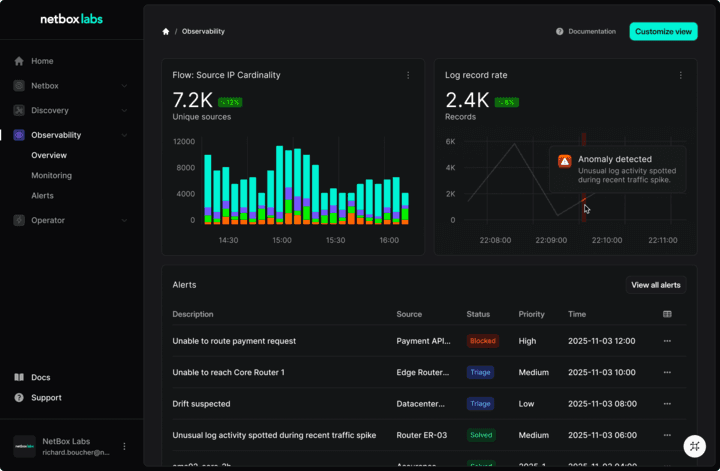
Unified interface. Observability dashboards are embedded directly into the NetBox user experience. Everything you need – documentation, topology, metrics, alerts – lives in one place.
What You Can Do With NetBox Observability
Get Alerts That Actually Help You
Stop getting generic alerts. Start getting intelligence.
When something goes wrong, NetBox Observability doesn’t just tell you there’s a problem. It tells you what the problem means.
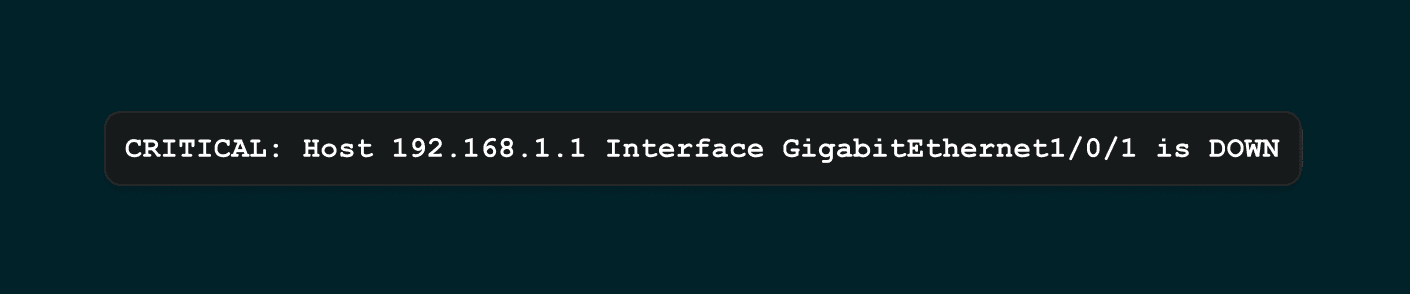
Instead of this:
You get this:
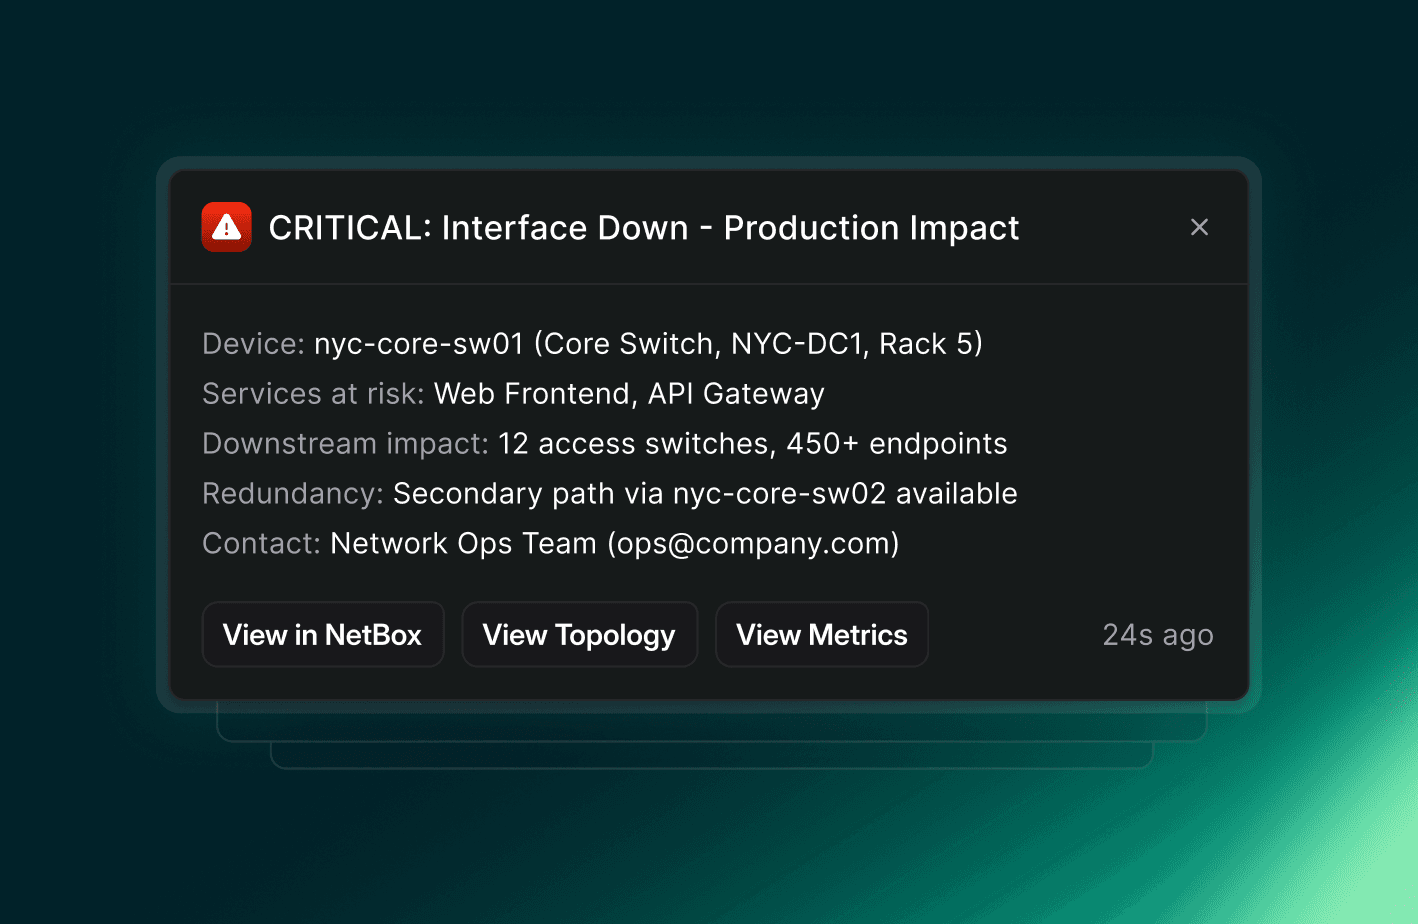
Every alert includes NetBox information such as device role, physical location, service dependencies, ownership information, and direct links to documentation and metrics.
You know immediately what’s broken, what’s affected, and who to call.
As NetBox Observability evolves, topology intelligence will enable even smarter alerting. When critical infrastructure fails, the system will suppress downstream alerts and surface just the root cause. Impact analysis will trace your topology automatically, showing exactly which components are unreachable and which services are degraded.
Stop Switching Tools During Incidents
Incident response today means jumping between tools. Monitoring dashboard. NetBox for topology. Documentation. Back to monitoring for metrics.
NetBox Observability puts it all in one place.
Alert fires. You’re already using NetBox . Click the affected component. Topology visualization shows you the relationships. Real-time metrics are right there. Documentation is right there. Everything you need to understand and resolve the issue without opening another tab.
Dashboards automatically organize around your infrastructure design – by site, by device role, by service. Add a new datacenter to NetBox, and monitoring dashboards reflect that structure automatically. No manual dashboard maintenance.
Your monitoring interface matches how you actually think about your infrastructure.
Prove Your Infrastructure Does What It’s Supposed To
Here’s something significant: NetBox Observability will enable you to validate that your infrastructure’s operational behavior matches your documented design.
Your security zones are documented in NetBox. NetBox Observability will prove through telemetry that traffic patterns and access controls respect those boundaries.
Your compliance framework requires network segmentation and infrastructure controls. NetBox Observability will demonstrate that these policies are operationally effective.
One platform serves as both the authoritative documentation and the operational proof that your infrastructure behaves as designed.
This is particularly powerful for security and compliance teams who need to show not just that policies are documented, but that they’re actually being enforced in practice.
Who This Is For
If you’re using NetBox to document your network and infrastructure, this is the natural next step. Transform that documentation from a reference into active operational intelligence.
If you’re running traditional monitoring tools (Nagios, Zabbix, PRTG) that generate alerts without business context, NetBox Observability gives you the architectural awareness those tools can’t provide.
If you’re managing complex, multi-vendor environments with diverse infrastructure requiring broad monitoring support, you get proven protocol support enhanced with NetBox intelligence.
If you’re on a security or compliance team, you get one platform that serves as both the authoritative documentation and the operational validation that your infrastructure behaves as designed.
Why Open Standards Matter
NetBox Observability is built on OpenTelemetry Protocol – the CNCF standard for observability data.
This means vendor neutrality. You’re not locked into proprietary data formats.
This means backend flexibility. The solution works with bundled components today, but can integrate with cloud-based observability platforms or your existing stack.
This means future-proof architecture. As OTLP gains industry momentum, you’re building on a foundation that evolves with standards rather than fighting against them.
For organizations concerned about vendor lock-in or uncertain about their long-term observability strategy, this open standards foundation means NetBox Observability integrates with your infrastructure rather than isolating it.
What’s Next
We’re actively developing NetBox Observability for launch next year. It will be available as part of NetBox Enterprise and NetBox Cloud.
We want to hear from you. What takes the most time during incident response today? What context is missing from your current alerts? How would topology-aware monitoring change your operations?
The future of infrastructure monitoring isn’t collecting more metrics. It’s understanding what those metrics mean in the context of your design, relationships, and business impact.
NetBox Observability brings that intelligence to every alert, every dashboard, and every incident response.
