Advanced Tools and Troubleshooting
This guide provides diagnostic procedures and solutions for issues you may encounter when running NetBox Enterprise.
Accessing Your Cluster
Most troubleshooting procedures require cluster access through either the command line or web console.
Command-Line Access
Prerequisite: NetBox Enterprise installer deployment.
Enter the cluster shell environment to use kubectl and related tools:
/var/lib/embedded-cluster/bin/netbox-enterprise shell
This shell session has kubectl preconfigured with cluster credentials and context. All subsequent kubectl commands execute within this environment.
Example session:
# Enter cluster shell
/var/lib/embedded-cluster/bin/netbox-enterprise shell

# Now kubectl commands work
kubectl -n kotsadm get pods

# Exit shell when done
exit
Web Console Access
Access the admin console in a browser at https://<your-cluster-host-or-ip>:30000/ where <your-cluster-host-or-ip> is your server hostname or IP address.
The admin console provides:
- Configuration management
- Log viewing
- System status monitoring
- Application deployment controls
Note: The admin console uses a self-signed certificate by default. Your browser will display a security warning on first access.
Getting Help
If you encounter an issue that is not covered in this guide, contact NetBox Labs support with the following information:
- NetBox Enterprise version
- Kubernetes cluster environment details
- Support bundle (see Generating a Support Bundle)
- Relevant error messages from logs
Diagnostic Tools
Support Bundles
Support bundles collect system information, configuration, and logs for troubleshooting. Generate a support bundle when reporting issues to NetBox Labs.
Command-line generation:
- Access your cluster from the shell
- Run the support bundle collector:
kubectl support-bundle /var/lib/embedded-cluster/support/host-support-bundle.yaml --load-cluster-specs
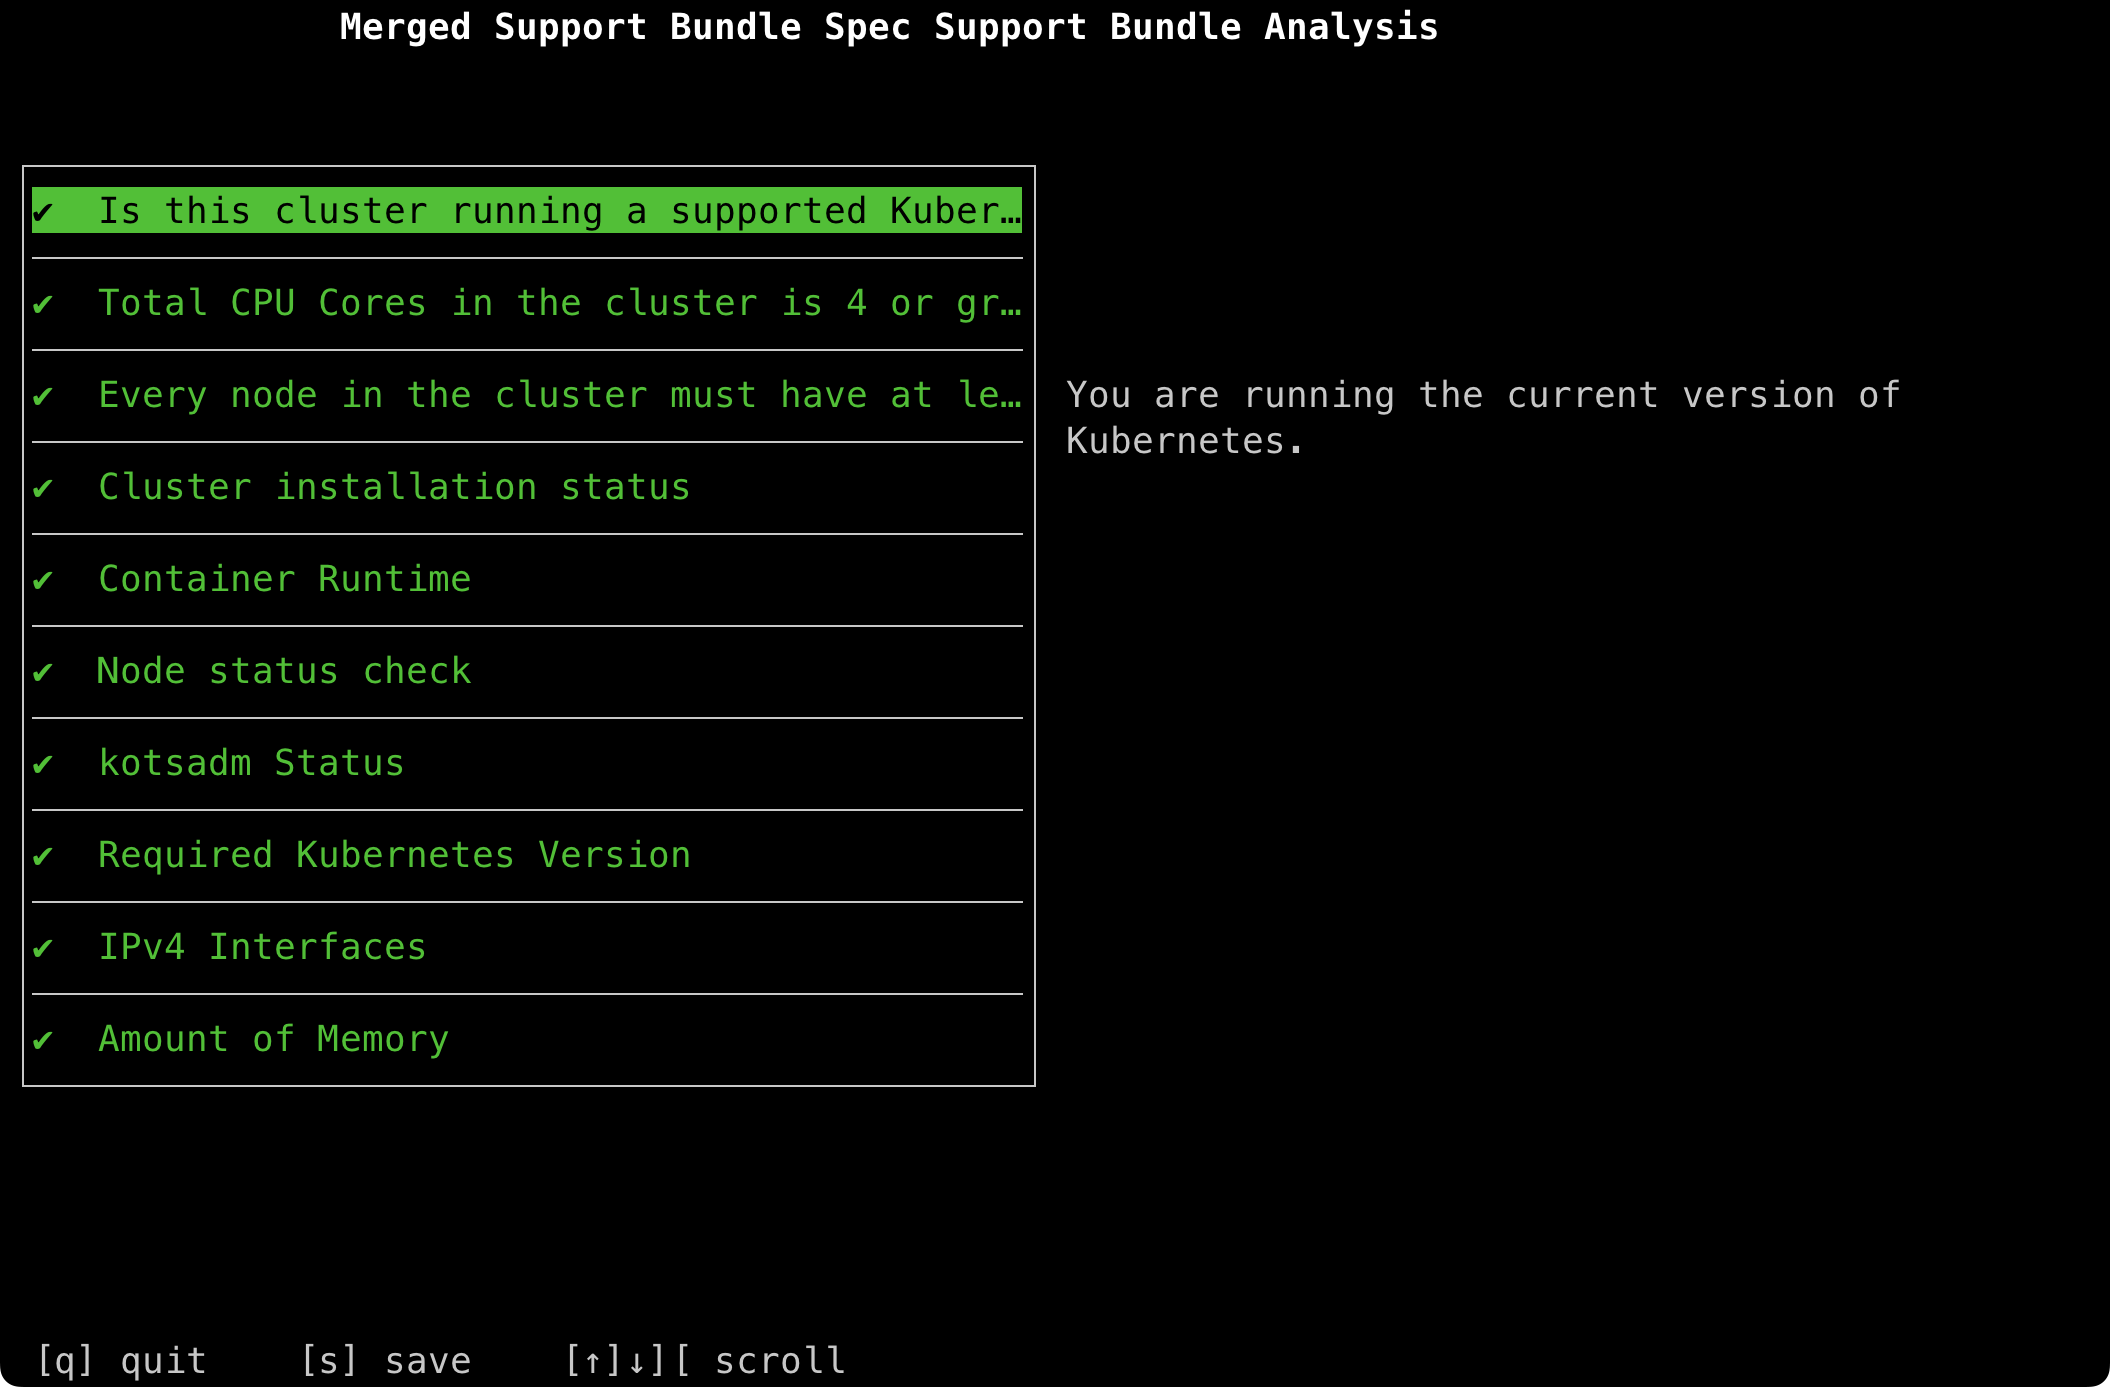
The tool runs diagnostic tests and displays results in a TUI interface. Press s to save a summary text file or q to quit. A .tar.gz bundle file is created in the current directory regardless of the option selected.
Log Access
View container logs directly using kubectl:
kubectl logs netbox-enterprise-<pod_id> -n kotsadm
Replace <pod_id> with the actual pod identifier from your cluster.
Common Issues
Git Repository Sync Failures
Symptoms:
- Large repositories (over 1GB) fail to sync
- Sync operations timeout
- Worker pods are killed with out-of-memory (OOM) errors
- Files larger than 50MB fail to process
Cause: Default worker pod resource limits are insufficient for large repository operations.
Solution:
Increase worker pod resource allocation through the admin console:
- Access the admin console at
https://your-cluster-host-or-ip:30000/ - Navigate to Config section
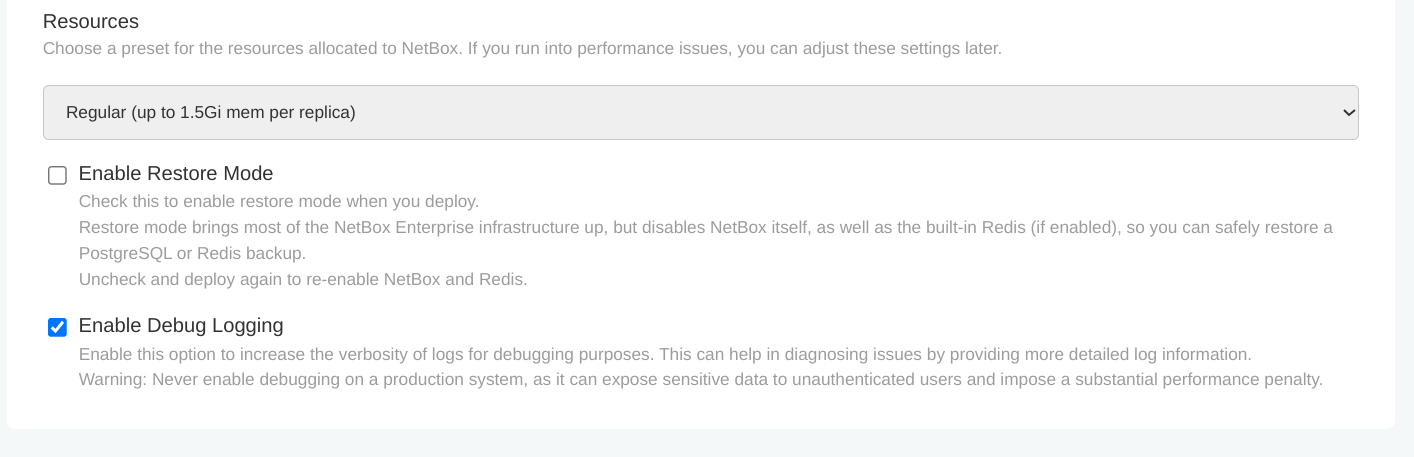
- Under Resources, select an appropriate preset:
- Regular (up to 1.5Gi mem per replica): Standard workloads
- Large (up to 3Gi mem per replica): Moderate to heavy workloads
- Extra Large (up to 6Gi mem per replica): Very large repositories
- 2x Large (up to 12Gi mem per replica): Repositories over 1GB
- Click Save Config
- Deploy the updated configuration
Verification:
Check that worker pods have restarted with new resource limits:
# Verify resource limits
kubectl -n kotsadm get deployment netbox-enterprise-worker -o yaml \
  | yq -r '.spec.template.spec.containers[] | select(.name == "netbox-worker") | .resources'

# Check worker pod status
kubectl -n kotsadm get pods -l app=netbox-enterprise-worker

# Monitor pod restart
kubectl -n kotsadm get pods -w
Test repository sync:
- Navigate to Operations > Integrations > Data Sources in NetBox
- Add or select your Git repository
- Click Sync and monitor progress
- Verify completion in the NetBox UI or worker logs
Additional steps if issue persists:
- Use
.gitignorepatterns to exclude large binary files not needed for NetBox - Split large monorepos into smaller, focused repositories
- Contact NetBox Labs support for specialized configuration
Excessive Log Output
Symptoms:
- Log storage fills rapidly
- Difficult to locate relevant error messages
- Performance degradation due to high I/O
Cause: Debug logging is enabled in a production environment.
Solution:
Disable debug logging through the admin console:
- Access the admin console
- Navigate to Config section
- Find Enable Debug Logging toggle
- Disable the toggle
- Click Save Config
- Deploy the updated configuration
Important: Debug logging exposes detailed system information and significantly impacts performance. Only enable debug mode in non-production environments when actively troubleshooting issues.
Enabling Debug Logging (Non-Production Only)
Debug logging provides detailed operational information for diagnosing issues. Enable it only in development or test environments.
Never enable debug logging on a production system. It can expose sensitive data to unauthenticated users and impose a substantial performance penalty.
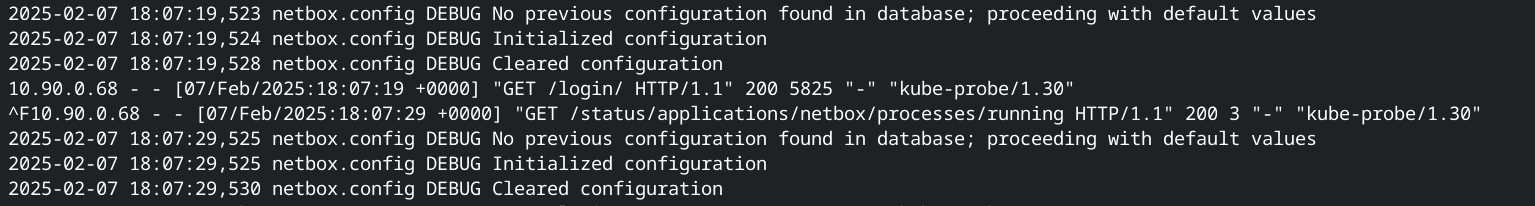
When enabled, this setting (custom_logging_enabled in the Admin Console) sets Diode components (Ingester, Reconciler, Auth) to DEBUG logging level, providing verbose output useful for diagnosing integration and data ingestion issues.
Steps:
- Access the admin console
- Navigate to Config section
- Find Enable Debug Logging toggle
- Enable the toggle
- Click Save Config
- Deploy the updated configuration
View debug logs:
kubectl logs netbox-enterprise-<pod_id> -n kotsadm
Disable debug logging after completing troubleshooting to restore normal performance.
Cluster Access Issues
Symptoms:
- Cannot connect to admin console
- kubectl commands fail
- Cannot access NetBox web interface
Solution:
Web console access:
The admin console is available at https://your-cluster-host-or-ip:30000/ in default installations.
Command-line access:
For NetBox Enterprise installer deployments, enter the cluster shell environment:
/var/lib/embedded-cluster/bin/netbox-enterprise shell
This provides a shell with kubectl configured to interact with the embedded cluster.
Command-Line Tools Reference
NetBox Enterprise includes specialized tools for cluster management and diagnostics. All tools require cluster access as described in Accessing Your Cluster.
kubectl
Standard Kubernetes CLI for interacting with cluster resources. Included with NetBox Enterprise installer.
Common operations:
# List all pods in the kotsadm namespace
kubectl -n kotsadm get pods

# View pod logs
kubectl logs <pod-name> -n kotsadm

# Describe a resource
kubectl describe pod <pod-name> -n kotsadm

# Get deployment details
kubectl -n kotsadm get deployment <deployment-name> -o yaml
preflight
Validation tool that checks system requirements before deployment or upgrade. Included with NetBox Enterprise installer.
Manual installation:
curl https://krew.sh/preflight | bash
Usage:
# Run preflight checks
kubectl preflight <spec-file>

# Example with NetBox Enterprise spec
kubectl preflight /var/lib/embedded-cluster/support/host-preflight.yaml
Use preflight when planning upgrades or diagnosing installation issues.
support-bundle
Generates comprehensive diagnostic bundles containing logs, configuration, and cluster state. Included with NetBox Enterprise installer.
Manual installation:
curl https://krew.sh/support-bundle | bash
Usage:
# Generate support bundle
kubectl support-bundle <spec-file> --load-cluster-specs

# Example with NetBox Enterprise spec
kubectl support-bundle /var/lib/embedded-cluster/support/host-support-bundle.yaml --load-cluster-specs
The command creates a .tar.gz file in the current directory. Provide this file to NetBox Labs support when reporting issues.
Output options:
- Press
sto save a summary text file - Press
qto quit (bundle file is still created)
k9s
Optional terminal UI for managing and viewing cluster resources interactively. Not included with installer.
Installation:
See installation instructions at k9scli.io.
Usage:
# Launch k9s
k9s
K9s provides a visual interface for common kubectl operations and real-time resource monitoring.
Advanced Configuration Reference
The Admin Console exposes additional configuration options under Show Advanced Settings. The following settings are available for specialized deployment scenarios.
Custom Object Types Limit
The max_custom_object_types setting limits the number of custom object types that can be created using the netboxlabs-netbox-custom-objects plugin. This protects database infrastructure from excessive schema modifications.
| Setting | Default | Description |
|---|---|---|
max_custom_object_types | 50 | Maximum number of custom object types. Set to 0 for unlimited. |
This option is visible in the Admin Console under Config > Show Advanced Settings.
Extra CA Certificates
The extra_ca_certificates setting allows uploading a custom CA certificate bundle. Use this when NetBox Enterprise needs to trust certificates signed by an internal or private certificate authority.
Common scenarios requiring custom CA certificates:
- Self-signed certificates on external PostgreSQL
- Self-signed certificates on external Redis with TLS
- Self-signed certificates on S3-compatible storage (e.g., MinIO)
- LDAPS connections using an internal CA
To configure:
- Access the Admin Console
- Navigate to Config > Show Advanced Settings
- Upload your CA certificate bundle in the Extra CA Certificates field
- Click Save Config and deploy
For MITM proxy environments, use the --private-ca installer flag instead. See Proxy Environments for details.
Internal Proxy for NetBox Containers
The use_proxies_inside_netbox setting configures proxy settings inside the NetBox containers themselves. By default, proxy configuration only applies to the cluster infrastructure. Enable this option when NetBox needs to route outbound requests (e.g., webhooks, external API calls, data source synchronization) through a proxy.
This option is visible in the Admin Console under Config > Show Advanced Settings in the Ingress section.
This is separate from the --http-proxy and --https-proxy installer flags, which configure cluster-level proxy settings. The use_proxies_inside_netbox option extends those proxy settings into the NetBox application containers.