Advanced Tools and Troubleshooting
Diagnostic procedures and solutions for common NetBox Enterprise issues
This guide provides diagnostic procedures and solutions for issues you may encounter when running NetBox Enterprise.
Accessing Your Cluster
Most troubleshooting procedures require cluster access through either the command line or web console.
Command-Line Access
Prerequisite: NetBox Enterprise installer deployment.
Enter the cluster shell environment to use kubectl and related tools:
/var/lib/embedded-cluster/bin/netbox-enterprise shellThis shell session has kubectl preconfigured with cluster credentials and context. All subsequent kubectl commands execute within this environment.
Example session:
# Enter cluster shell
/var/lib/embedded-cluster/bin/netbox-enterprise shell

# Now kubectl commands work
kubectl -n kotsadm get pods

# Exit shell when done
exit
Web Console Access
Access the admin console in a browser at https://<your-cluster-host-or-ip>:30000/ where <your-cluster-host-or-ip> is your server hostname or IP address.
The admin console provides:
- Configuration management
- Log viewing
- System status monitoring
- Application deployment controls
Note: The admin console uses a self-signed certificate by default. Your browser will display a security warning on first access.
Getting Help
If you encounter an issue that is not covered in this guide, contact NetBox Labs support with the following information:
- NetBox Enterprise version
- Kubernetes cluster environment details
- Support bundle (see Generating a Support Bundle)
- Relevant error messages from logs
Diagnostic Tools
Support Bundles
Support bundles collect system information, configuration, and logs for troubleshooting. Generate a support bundle when reporting issues to NetBox Labs.
Command-line generation:
- Access your cluster from the shell
- Run the support bundle collector:
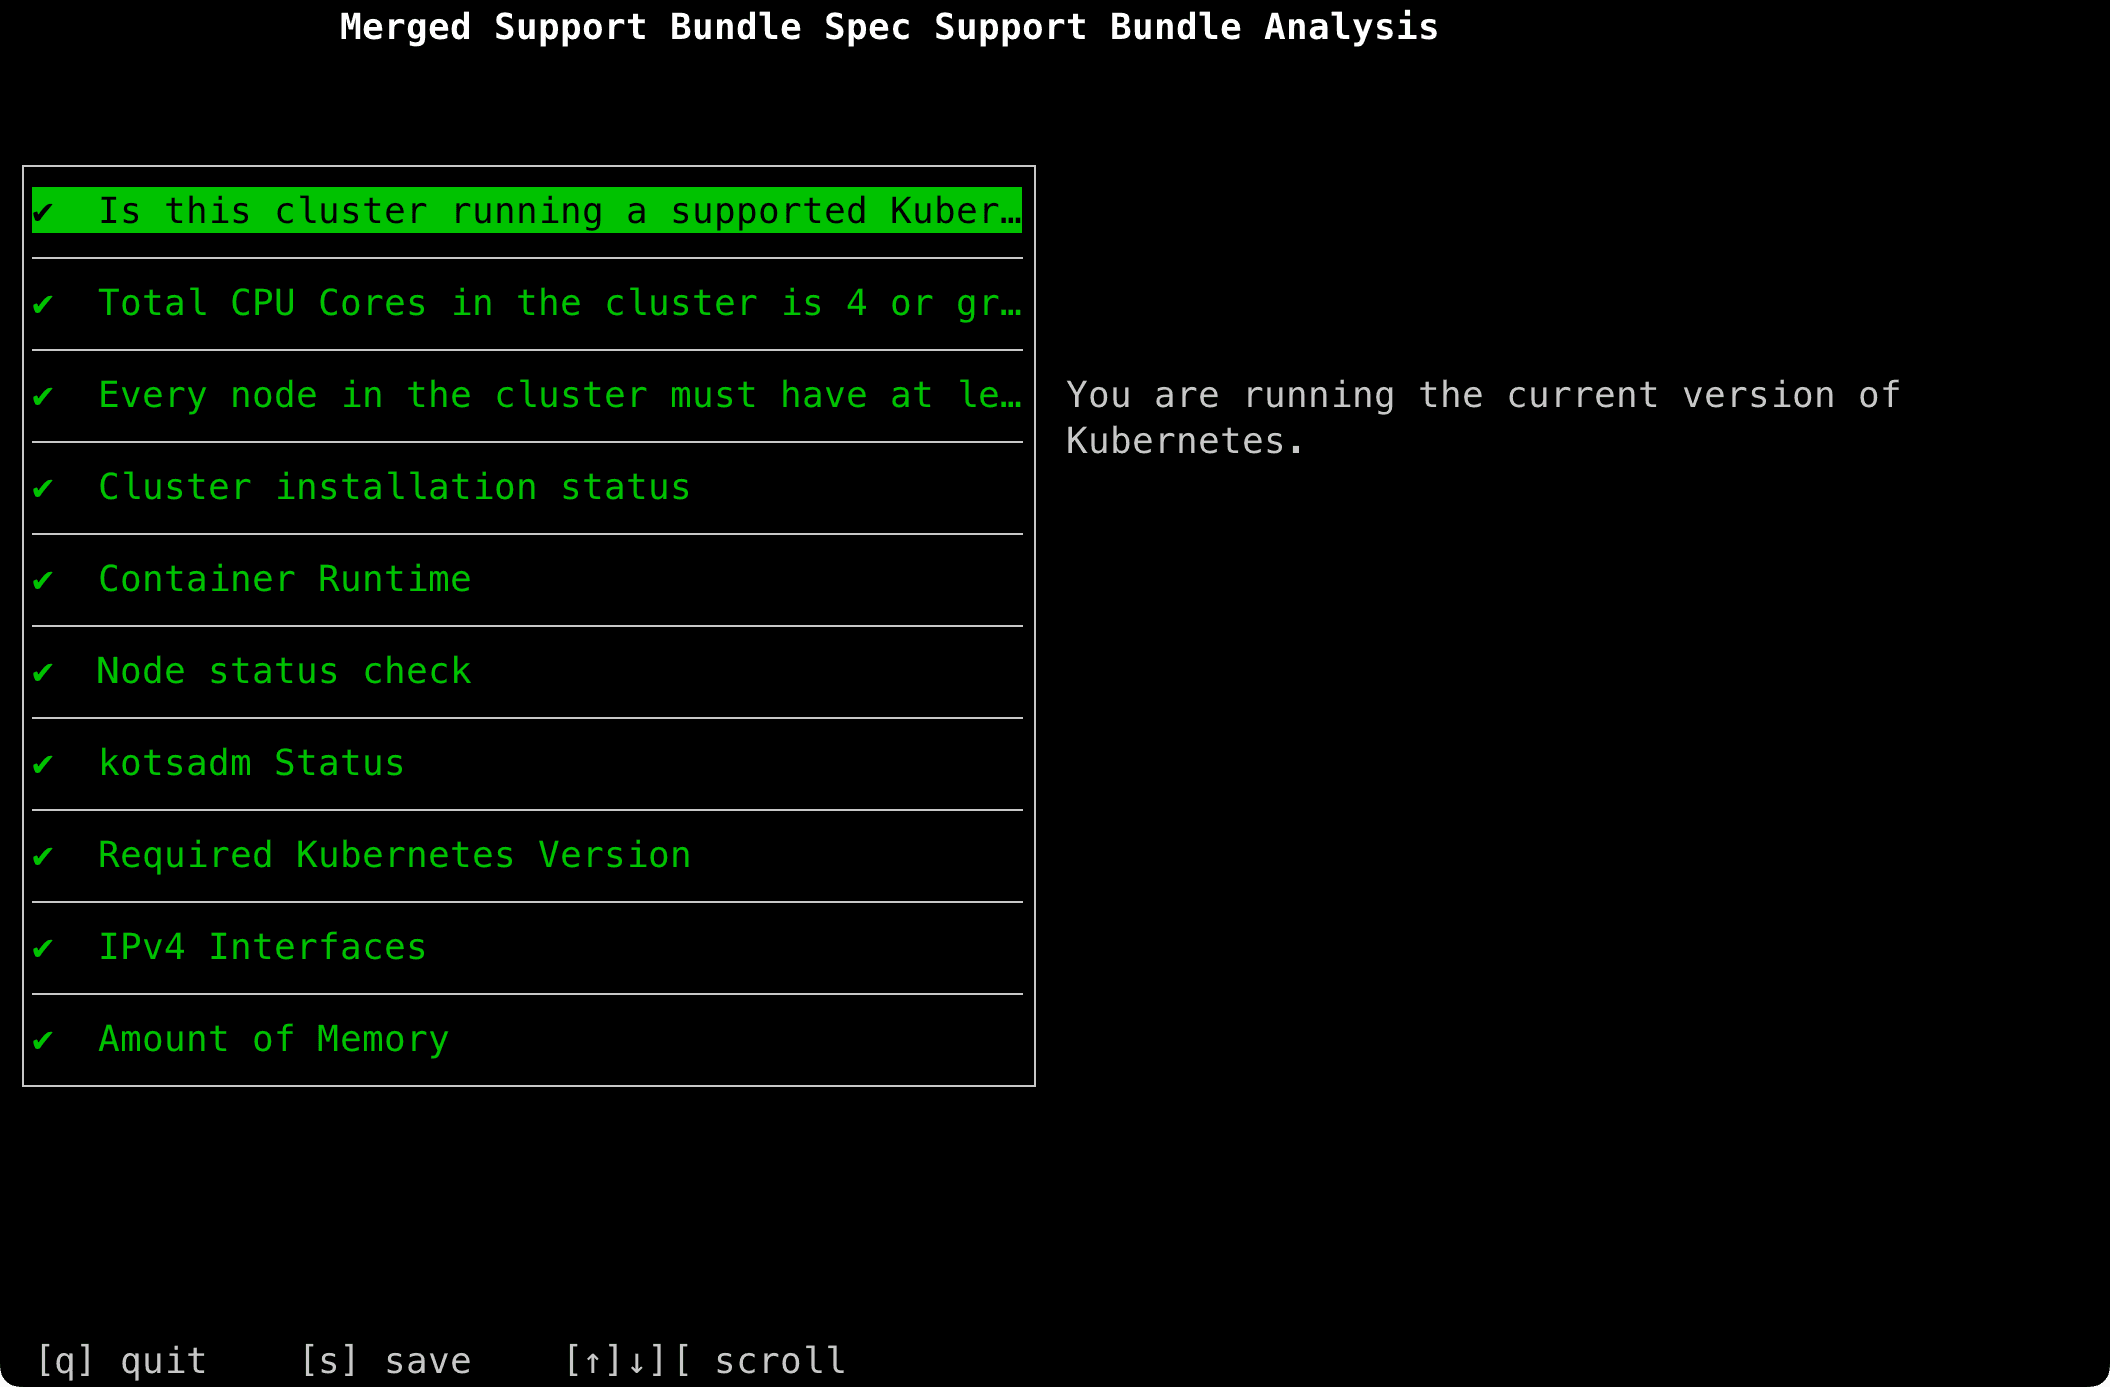
kubectl support-bundle /var/lib/embedded-cluster/support/host-support-bundle.yaml --load-cluster-specsThe tool runs diagnostic tests and displays results in a TUI interface. Press s to save a summary text file or q to quit. A .tar.gz bundle file is created in the current directory regardless of the option selected.
Log Access
View container logs directly using kubectl:
kubectl logs netbox-enterprise-<pod_id> -n kotsadmReplace <pod_id> with the actual pod identifier from your cluster.
Common Issues
Git Repository Sync Failures
Symptoms:
- Large repositories (over 1GB) fail to sync
- Sync operations timeout
- Worker pods are killed with out-of-memory (OOM) errors
- Files larger than 50MB fail to process
Cause: Default worker pod resource limits are insufficient for large repository operations.
Solution:
Increase worker pod resource allocation through the admin console:
- Access the admin console at
https://your-cluster-host-or-ip:30000/ - Navigate to Config section
- Under Resources, select an appropriate preset:
- Regular (up to 1.5Gi mem per replica): Standard workloads
- Large (up to 3Gi mem per replica): Moderate to heavy workloads
- Extra Large (up to 6Gi mem per replica): Very large repositories
- 2x Large (up to 12Gi mem per replica): Repositories over 1GB
- Click Save Config
- Deploy the updated configuration
Verification:
Check that worker pods have restarted with new resource limits:
# Verify resource limits
kubectl -n kotsadm get deployment netbox-enterprise-worker -o yaml \
  | yq -r '.spec.template.spec.containers[] | select(.name == "netbox-worker") | .resources'

# Check worker pod status
kubectl -n kotsadm get pods -l app=netbox-enterprise-worker

# Monitor pod restart
kubectl -n kotsadm get pods -w
Test repository sync:
- Navigate to Operations > Integrations > Data Sources in NetBox
- Add or select your Git repository
- Click Sync and monitor progress
- Verify completion in the NetBox UI or worker logs
Additional steps if issue persists:
- Use
.gitignorepatterns to exclude large binary files not needed for NetBox - Split large monorepos into smaller, focused repositories
- Contact NetBox Labs support for specialized configuration
CERTIFICATE_VERIFY_FAILED Behind a TLS-Inspecting Proxy
Symptoms:
- A Git or S3 data source fails to sync with
SSL: CERTIFICATE_VERIFY_FAILED - The dashboard news feeds or a plugin such as NDX fail with the same error
- HTTPS to the same destination works from outside NetBox
Cause:
A TLS-inspecting proxy decrypts outbound HTTPS and signs it again with its own certificate authority (CA). NetBox checks the certificate the proxy presents, not the certificate of the destination. If NetBox does not trust the proxy's CA, the request fails. The error names a certificate, but the cause is the proxy.
Trusting your internal CA is not enough. The proxy's signing CA must also be trusted, unless your internal CA is the one the proxy signs with.
Solution:
- Get the proxy's signing CA certificate, PEM-encoded, from the team that runs the proxy.
- In the Admin Console, go to Config > Show Advanced Settings > Extra CA Certificates.
- Paste the certificate into Additional CA Certificates. Keep the certificates that are already there and add this one after them.
- Click Save Config and deploy.
On a Helm install, add the certificate to spec.extraCaCertificates.
You do not need to set REQUESTS_CA_BUNDLE, AWS_CA_BUNDLE or SSL_CERT_FILE in NetBox Environment Overrides.
NetBox Enterprise already points NetBox and its workers at the trust store that holds these certificates.
If the destination is internal and should not go through the proxy at all, exclude it from the proxy instead. See Excluding destinations from the proxy.
Excessive Log Output
Symptoms:
- Log storage fills rapidly
- Difficult to locate relevant error messages
- Performance degradation due to high I/O
Cause: Debug logging is enabled in a production environment.
Solution:
Disable debug logging through the admin console:
- Access the admin console
- Navigate to Config section
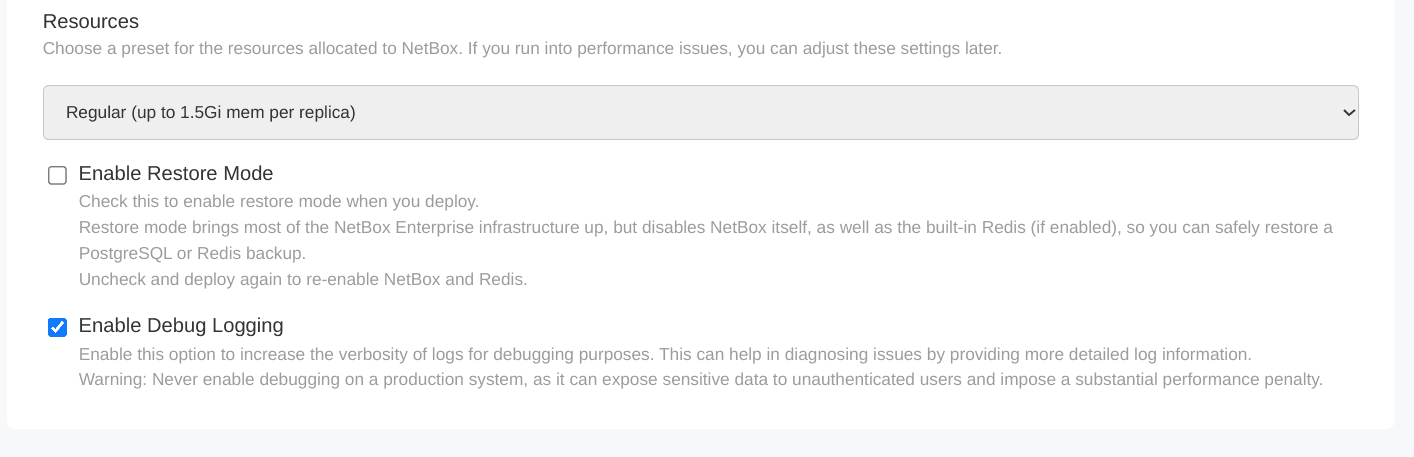
- Find Enable Debug Logging toggle
- Disable the toggle
- Click Save Config
- Deploy the updated configuration
Important: Debug logging exposes detailed system information and significantly impacts performance. Only enable debug mode in non-production environments when actively troubleshooting issues.
Enabling Debug Logging (Non-Production Only)
Debug logging provides detailed operational information for diagnosing issues. Enable it only in development or test environments.
Production Warning
Never enable debug logging on a production system. It can expose sensitive data to unauthenticated users and impose a substantial performance penalty.
When enabled, this setting (custom_logging_enabled in the Admin Console) sets Diode components (Ingester, Reconciler, Auth) to DEBUG logging level, providing verbose output useful for diagnosing integration and data ingestion issues.
Steps:
- Access the admin console
- Navigate to Config section
- Find Enable Debug Logging toggle
- Enable the toggle
- Click Save Config
- Deploy the updated configuration
View debug logs:
kubectl logs netbox-enterprise-<pod_id> -n kotsadm
Disable debug logging after completing troubleshooting to restore normal performance.
Cluster Access Issues
Symptoms:
- Cannot connect to admin console
- kubectl commands fail
- Cannot access NetBox web interface
Solution:
Web console access:
The admin console is available at https://your-cluster-host-or-ip:30000/ in default installations.
Command-line access:
For NetBox Enterprise installer deployments, enter the cluster shell environment:
/var/lib/embedded-cluster/bin/netbox-enterprise shellThis provides a shell with kubectl configured to interact with the embedded cluster.
Manual edits to the NetBoxEnterprise resource are reverted
Symptoms:
- Changes made with
kubectl edit netboxenterprisesdisappear after the next deploy - Configuration reverts to what the Admin Console shows
Cause:
The Admin Console is the source of truth for the NetBoxEnterprise custom resource. Editing the resource directly (for example, kubectl edit netboxenterprises) is not supported. The console overwrites the resource on the next deploy, so manual edits are lost.
Solution:
Make configuration changes through the Admin Console at https://your-cluster-host-or-ip:30000/, then Save Config and deploy. For settings the console does not expose (such as valueFrom: secretKeyRef environment variables), apply them through a Helm deployment instead, where the custom resource is authoritative.
Redis Out-Of-Memory Restart Loop
Symptoms:
- The Redis pod restarts repeatedly under memory pressure
- Redis is killed with OOM and re-fills memory on startup, then is killed again
- The ingester rejects ingest with
ResourceExhausted
Cause: With append-only file (AOF) persistence enabled, a restarted Redis replays its entire write log, re-filling memory immediately and triggering another OOM kill. Without a memory cap, Redis grows until the pod hits its limit.
Solution:
For operator-managed (built-in) Redis, tune memory through the Admin Console under Config > Show Advanced Settings > Redis Tuning, or through the custom resource on Helm:
- Set AOF (Append-Only File) Mode to Disabled. A restart then loads the compact RDB snapshot instead of replaying every write, so a crashed Redis does not re-fill memory on startup. The NetBox cache is preserved; in-flight Diode stream events are lost on crash.
- Set Redis Memory Cap to a percentage of the pod limit (for example,
80) and choose an eviction policy such asallkeys-lru. This requires a Redis memory limit, set via the Redis Resources preset.
The equivalent custom-resource fields (redis.aofEnabled, redis.maxMemoryPercent, redis.maxMemoryPolicy) are documented in Redis Configuration.
Changing these settings rolls the Redis pod once on the next deploy to apply the new configuration. This is expected.
Deployment Stuck in "Updating" or "Reconciling"
Symptoms:
- The
NetBoxEnterpriseresource reportsReconcilingorComponentsNotReadyfor an extended period kubectl get netboxenterprisesshowsREADYasfalseafter a config change
Cause: The operator processes each spec change and waits for every component to become ready before marking the cluster ready. During an image upgrade, migration, or pod roll, the resource stays in a progressing state until the rollout converges.
Solution:
Check whether the operator has caught up with the latest spec change:
kubectl -n netbox get netboxenterprise netbox \
-o jsonpath='gen={.metadata.generation} observed={.status.observedGeneration} converged={.status.convergedGeneration}'- When
convergedGenerationequalsmetadata.generation, the current configuration has fully rolled out. - When
observedGenerationis behindmetadata.generation, the operator has not yet processed the latest change.
Inspect component status and operator events to find what is still progressing:
kubectl -n netbox get netboxenterprise netbox -o jsonpath='{.status.components}' | jq
kubectl -n netbox get events --field-selector source=nbe-operator
See Status & Conditions for the full field and condition reference. If a component stays unready, check that pod's logs for the underlying failure.
Gateway Logs middleware does not exist at Startup
On the bundled Traefik gateway, you may see a brief burst of errors like middleware "<namespace>-<name>@kubernetescrd" does not exist in the gateway pod logs each time it starts. This is expected: Traefik's Gateway API provider publishes routes a moment before its CRD provider finishes indexing the request body-size Middleware, so the reference is briefly unresolved before it self-heals (typically within a second).
A short burst at startup is benign. Errors that persist past startup indicate the traefik.io Middleware CRD is missing. Install the netbox-enterprise-crds-traefik chart (Embedded Cluster installs it automatically). See Prerequisites.
Command-Line Tools Reference
NetBox Enterprise includes specialized tools for cluster management and diagnostics. All tools require cluster access as described in Accessing Your Cluster.
kubectl
Standard Kubernetes CLI for interacting with cluster resources. Included with NetBox Enterprise installer.
Common operations:
# List all pods in the kotsadm namespace
kubectl -n kotsadm get pods

# View pod logs
kubectl logs <pod-name> -n kotsadm

# Describe a resource
kubectl describe pod <pod-name> -n kotsadm

# Get deployment details
kubectl -n kotsadm get deployment <deployment-name> -o yaml
preflight
Validation tool that checks system requirements before deployment or upgrade. Included with NetBox Enterprise installer.
Manual installation:
curl https://krew.sh/preflight | bashUsage:
# Run preflight checks
kubectl preflight <spec-file>

# Example with NetBox Enterprise spec
kubectl preflight /var/lib/embedded-cluster/support/host-preflight.yaml
Use preflight when planning upgrades or diagnosing installation issues.
support-bundle
Generates comprehensive diagnostic bundles containing logs, configuration, and cluster state. Included with NetBox Enterprise installer.
Manual installation:
curl https://krew.sh/support-bundle | bashUsage:
# Generate support bundle
kubectl support-bundle <spec-file> --load-cluster-specs

# Example with NetBox Enterprise spec
kubectl support-bundle /var/lib/embedded-cluster/support/host-support-bundle.yaml --load-cluster-specs
The command creates a .tar.gz file in the current directory. Provide this file to NetBox Labs support when reporting issues.
Output options:
- Press
sto save a summary text file - Press
qto quit (bundle file is still created)
k9s
Optional terminal UI for managing and viewing cluster resources interactively. Not included with installer.
Installation:
See installation instructions at k9scli.io.
Usage:
# Launch k9s
k9s
K9s provides a visual interface for common kubectl operations and real-time resource monitoring.
Advanced Configuration Reference
The Admin Console exposes additional configuration options under Show Advanced Settings. The following settings are available for specialized deployment scenarios.
Custom Object Types Limit
The max_custom_object_types setting limits the number of custom object types that can be created using the netboxlabs-netbox-custom-objects plugin. This protects database infrastructure from excessive schema modifications.
| Setting | Default | Description |
|---|---|---|
max_custom_object_types | 50 | Maximum number of custom object types. Set to 0 for unlimited. |
This option is visible in the Admin Console under Config > Show Advanced Settings.
Extra CA Certificates
The extra_ca_certificates setting allows uploading a custom CA certificate bundle. Use this when NetBox Enterprise needs to trust certificates signed by an internal or private certificate authority.
Common scenarios requiring custom CA certificates:
- Self-signed certificates on external PostgreSQL
- Self-signed certificates on external Redis with TLS
- Self-signed certificates on S3-compatible storage (e.g., MinIO)
- LDAPS connections using an internal CA
To configure:
- Access the Admin Console
- Navigate to Config > Show Advanced Settings
- Paste your PEM-encoded CA certificates into the Additional CA Certificates field
- Click Save Config and deploy
TLS-inspecting proxies
If a proxy inspects TLS, add the proxy's signing CA here, so that NetBox trusts the traffic the proxy signs again. See CERTIFICATE_VERIFY_FAILED Behind a TLS-Inspecting Proxy.
On Embedded Cluster, the host must trust that CA too. Install it in the host trust store before you run the installer. Do not pass --private-ca: Embedded Cluster ignores it.
Proxies Inside the NetBox Containers
Proxy settings reach the NetBox containers on their own. If the deployment has a proxy configured, HTTP_PROXY, HTTPS_PROXY and NO_PROXY are set on NetBox, the workers, Copilot, Diode, Hydra and the migration Jobs. NetBox uses them for Git and S3 data source synchronization, the dashboard news feeds, and plugins such as NDX. Nothing needs to be enabled for this.
Webhooks are the exception. NetBox sends webhooks with the proxies in its own HTTP_PROXIES setting and ignores the proxy environment variables. NetBox Enterprise leaves HTTP_PROXIES empty, so webhooks go to their destination directly. If a webhook destination can only be reached through the proxy, set HTTP_PROXIES.
On Embedded Cluster and other KOTS installs, the proxy comes from the --http-proxy and --https-proxy installer flags and is shown read-only in the Admin Console. Direct Helm installs set it through global.replicated.
NO_PROXY always carries cluster-internal destinations — localhost, the in-cluster DNS suffixes and the RFC 1918 ranges — so pod-to-pod and Service traffic never goes through the proxy.
NetBox Enterprise 2.4.0 removes the Configure NetBox to Use Proxies checkbox. It had no effect from 2.0.0 to 2.3.x. There is no setting that turns the proxy off for NetBox alone. To keep some NetBox traffic off the proxy, see Excluding destinations from the proxy.
Before 2.3.0
In 2.0.0 to 2.2.x, NetBox and its workers do not use the proxy environment variables, so their outbound traffic goes directly to its destination. NO_PROXY has no effect on them. On those versions, set HTTP_PROXIES, and use a proxy router to keep destinations off the proxy.
Set HTTP_PROXIES
HTTP_PROXIES is the NetBox setting for the proxies that NetBox uses for its own outbound requests. Set it to send webhooks through the proxy.
-
In the Admin Console, go to Config > Show Advanced Settings.
-
Add the following to NetBox Python Configuration Overrides. Use the same proxy URL as the installer flags.
HTTP_PROXIES = { 'http': 'http://proxy.example.com:3128', 'https': 'http://proxy.example.com:3128', } -
Click Save Config and deploy.
On a Helm install, put the same Python in spec.netbox.config.customPythonConfig.
HTTP_PROXIES takes precedence over NO_PROXY. When it is set, NetBox sends webhooks, Git and S3 data source synchronization and the dashboard news feeds through the proxy, even if the destination is listed in NO_PROXY. If a destination must stay off the proxy, add a proxy router as well.
Excluding Destinations From the Proxy
Add the destinations to NO_PROXY:
- On Embedded Cluster, pass them to the installer with
--no-proxy. The proxy is an install-time setting. To change it, run the installer again with the new flags. See Proxy Environments. - On a Helm install, set
global.replicated.noProxy.
NetBox Enterprise adds your entries to the cluster-internal defaults.
For an S3 data source, list the host name of the S3 endpoint, not its IP range. The S3 client does not match a destination against an IP range such as 10.20.0.0/16.
If you have set HTTP_PROXIES, NO_PROXY alone keeps nothing in NetBox off the proxy. Add a proxy router as well.
Proxy Router
A proxy router is a Python class that chooses the proxy for each request NetBox makes. NetBox reads it from the PROXY_ROUTERS setting. The router below sends the hosts in BYPASS directly and every other request through HTTP_PROXIES.
Add it to NetBox Python Configuration Overrides, together with HTTP_PROXIES:
HTTP_PROXIES = {
    'http': 'http://proxy.example.com:3128',
    'https': 'http://proxy.example.com:3128',
}


class BypassProxyRouter:
    """Send the hosts in BYPASS directly, and everything else through HTTP_PROXIES."""

    # Hosts that NetBox must reach without the proxy.
    # An entry that starts with a dot matches that domain and every subdomain.
    BYPASS = ('git.example.com', '.internal.example.com')

    def route(self, url=None, protocol=None, context=None):
        from urllib.parse import urlparse
        from django.conf import settings

        host = (urlparse(url).hostname or '') if url else ''
        for entry in self.BYPASS:
            if host == entry.lstrip('.') or (entry.startswith('.') and host.endswith(entry)):
                return {'http': None, 'https': None}
        return settings.HTTP_PROXIES


PROXY_ROUTERS = [BypassProxyRouter]
Put the same hosts in NO_PROXY too. The Git client prefers the proxy environment variables to the proxy that the router chooses, so the router alone does not keep Git traffic off the proxy.
This table shows how NetBox 2.4.0 reaches a host that should stay off the proxy, when HTTP_PROXIES is set:
| Destination | Host in NO_PROXY only | Host in BYPASS only | Host in both |
|---|---|---|---|
| Git data source | Proxy | Proxy | Direct |
| S3 data source | Proxy | Direct | Direct |
| Webhook | Proxy | Direct | Direct |
| Dashboard news feed | Proxy | Direct | Direct |
NetBox documents HTTP_PROXIES and PROXY_ROUTERS in its system configuration reference.
Dashboard News Feeds
The NetBox dashboard loads two news feeds from the internet:
| Feed | URL |
|---|---|
| NetBox News | https://api.netbox.oss.netboxlabs.com/v1/newsfeed/ |
| Enterprise News | https://netboxlabs.com/docs/feeds/customer-messages.xml |
If the proxy blocks these hosts, the feeds do not load. Allow both hosts on the proxy. In 2.0.0 to 2.2.x, NetBox fetches the feeds directly, not through the proxy. Where direct traffic is dropped, the dashboard can hang until you set HTTP_PROXIES.
Related Documentation
Troubleshoot PostgreSQL Backups and Disaster Recovery
Find and fix problems with PostgreSQL backups, PostgreSQL restores, and disaster recovery restores of the built-in PostgreSQL.
NetBox Enterprise Release Notes
NetBox Enterprise 2.4.0 moves NetBox to 4.7.1 and Embedded Cluster to Kubernetes 1.35, turns off anonymous access by default, and makes the backups of the built-in database configurable.