Getting Started with the Cisco Catalyst Center Integration for NetBox
This guide will help you set up and start using the Catalyst Center Integration for NetBox.
Before using this guide you should ensure all prerequisites have been met.
Table of Contents
- NetBox Setup
- Agent Setup and Configuration
- View and Apply Discovered Data in NetBox Assurance
- View the Cisco Catalyst Center Data in NetBox
- Additional Resources
NetBox Setup
Generate Diode Client Credentials
- Log into your NetBox instance
- Navigate to Diode → Client Credentials
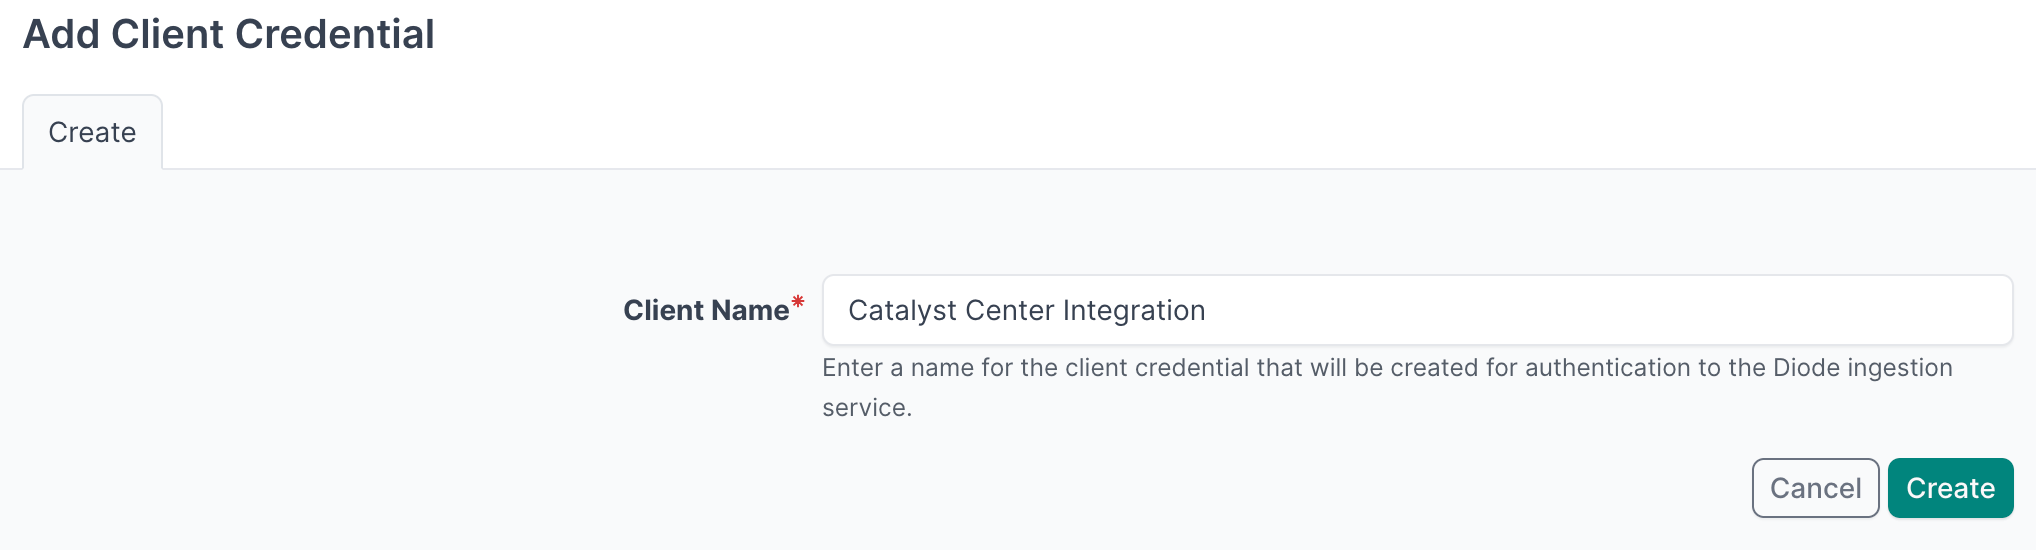
- Click + Add a Credential
- Enter a descriptive name (e.g., "Catalyst Center Integration")
- Click Create
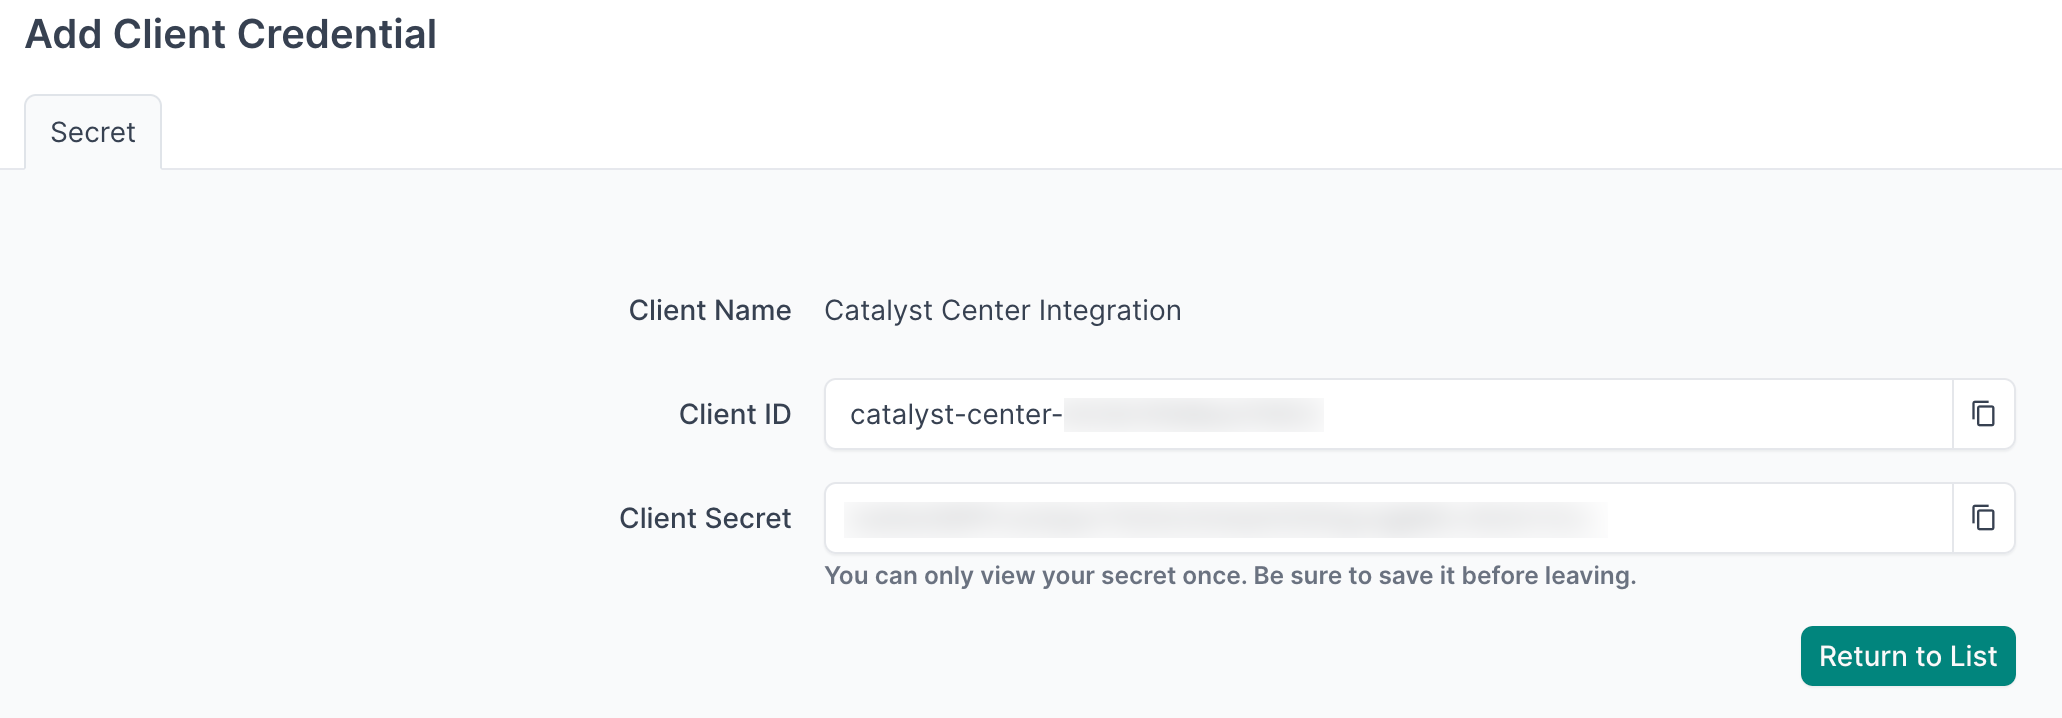
- Important: Copy and securely store the Client ID and Client Secret as you will reference this in the agent configuration file in later steps
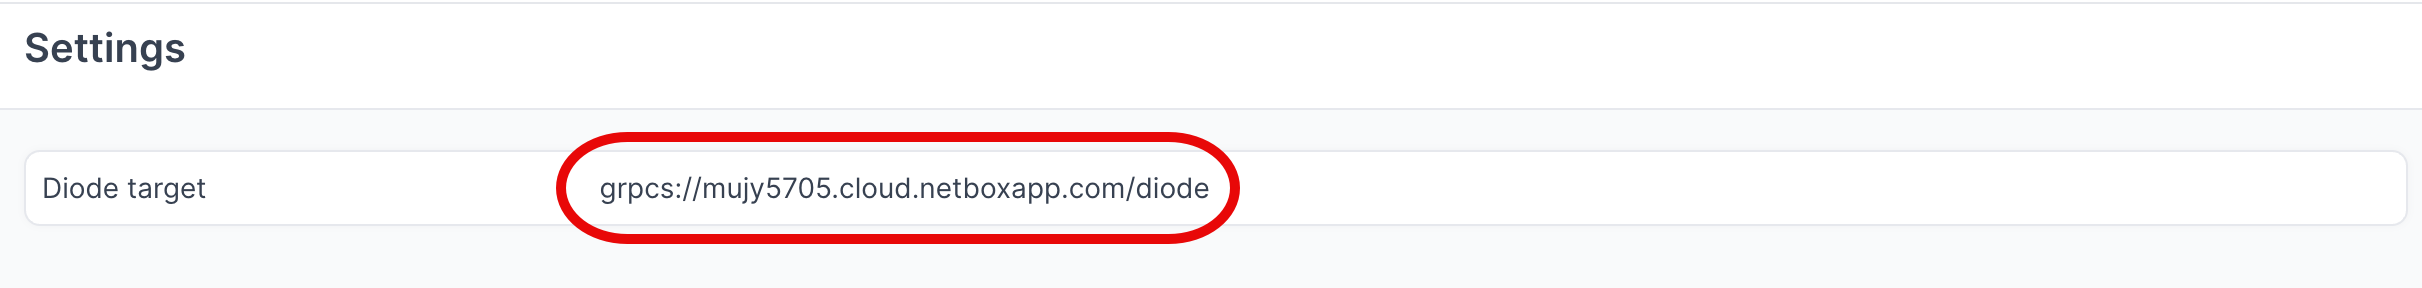
- Navigate to Diode → Settings
- Copy the value of the Diode target as you will reference this in the agent configuration file in later steps
Agent Setup and Configuration
You can deploy multiple agents configured to sync data from more than one Catalyst Center Controller
Step 1: Authenticate to the NetBox Labs Image Registry
From your host machine, authenticate to the NetBox Labs registry, using the CUSTOMER-IDENTIFIER and Token that you have been provided by the NetBox Labs team:
docker login -u<CUSTOMER-IDENTIFIER> netboxlabs.jfrog.io
Example session
% docker login -u<customer-abc123> netboxlabs.jfrog.io # note there are no spaces after -u
# Use the Token provided as the password when prompted
Password:
Login Succeeded
Step 2: Configure the Agent
- Create the configuration file (you can name the file anything you like):
touch agent.yaml
- Edit the configuration file with your preferred editor and add the following configuration. Important: Replace
your-instance.netboxcloud.comwith your actual NetBox instance hostname:
orb:
  config_manager:
    active: local
  backends:
    worker:
    common:
      diode:
        target: grpcs://your-instance.netboxcloud.com/diode
        client_id: ${DIODE_CLIENT_ID}
        client_secret: ${DIODE_CLIENT_SECRET}
        agent_name: cisco_catalyst_center_01  # Use a meaningful name to identify this agent
  policies:
    worker:
      cisco_catalyst_center_worker:
        config:
          package: nbl_cisco_catalyst_center
          schedule: "* * * * *"  # Set your desired schedule (see examples below)
          timeout: 5
          CCC_HOST: ${CCC_HOST}
          CCC_USER: ${CCC_USER}
          CCC_PWD: ${CCC_PWD}
        scope:
The schedule field uses cron syntax. Here are some common examples:
"* * * * *"- Every minute"0 */6 * * *"- Every 6 hours (e.g., 00:00, 06:00, 12:00, 18:00)"0 2 * * *"- Daily at 2:00 AM"0 9 * * 1"- Weekly on Monday at 9:00 AM
Optional - Dry Run Mode
The agent can be run in Dry Run mode, which means discovered data is written to a json formatted file instead of to NetBox. This can be useful for troubleshooting - for example you could share the file with the NetBox Labs support team to investigate issues ingesting certain data.
Enable this in the Diode section of your agent configuration file, by adding the dry_run key and setting the value to true (it is false by default) and set the dry_run_output_dir value to the location you want the file to be saved.
      diode:
        dry_run: true
        dry_run_output_dir: /opt/orb/ # this will save the output file into the same directory that you run the agent from
Step 3: Run the Agent
Run the agent to synchronize data from your Catalyst Center Controller into NetBox:
Method 1: Set Environment Variables Manually
- Export Diode credentials as environment variables:
export DIODE_CLIENT_ID="your-client-id"
export DIODE_CLIENT_SECRET="your-client-secret"
- Export Catalyst Center credentials as environment variables:
export CCC_HOST="https://your-catalyst-center-host"
export CCC_USER="your-catalyst-center-username"
export CCC_PWD="your-catalyst-center-password"
- Run the agent with the following command:
docker run \
  -v $PWD:/opt/orb/ \
  -e DIODE_CLIENT_SECRET \
  -e DIODE_CLIENT_ID \
  -e CCC_HOST \
  -e CCC_USER \
  -e CCC_PWD \
  netboxlabs.jfrog.io/obs-orb-agent-pro/orb-agent-pro \
  run -c /opt/orb/agent.yaml
Method 2: Use a .env File (Recommended)
- Create a
.envfile in your current directory:
touch .env
- Edit the
.envfile with your preferred editor and add the following content:
# NetBox Diode credentials (from Step 1)
DIODE_CLIENT_ID="your-client-id"
DIODE_CLIENT_SECRET="your-client-secret"

# Cisco Catalyst Center credentials
CCC_HOST="https://your-catalyst-center-host"
CCC_USER="your-catalyst-center-username"
CCC_PWD="your-catalyst-center-password"
Replace the placeholder values with your actual credentials:
your-client-idandyour-client-secretfrom the NetBox Diode setupyour-catalyst-center-hostwith your Catalyst Center controller URLyour-catalyst-center-usernameandyour-catalyst-center-passwordwith your Catalyst Center credentials
- Run the agent with the following command:
docker run \
  -v $PWD:/opt/orb/ \
  --env-file .env \
  netboxlabs.jfrog.io/obs-orb-agent-pro/orb-agent-pro \
  run -c /opt/orb/agent.yaml
When using Method 2, add .env to your .gitignore file to prevent accidentally committing sensitive credentials to version control:
echo ".env" >> .gitignore
Expected Output
After you issue the command to run the agent, depending on the schedule you defined in the configuration file, you should see similar to the output below:
...
{"time":"2025-07-20T15:15:05.667656922Z","level":"INFO","msg":"worker stderr","log":"INFO:nbl_cisco_catalyst_center.ccc_diode:Processing interface: GigabitEthernet0/0 on device sw4"}
{"time":"2025-07-20T15:15:05.667767339Z","level":"INFO","msg":"worker stderr","log":"INFO:nbl_cisco_catalyst_center.ccc_diode:Added interface entity: GigabitEthernet0/0 with type 1000base-t"}
{"time":"2025-07-20T15:15:05.667782006Z","level":"INFO","msg":"worker stderr","log":"INFO:nbl_cisco_catalyst_center.ccc_diode:Added MAC address entity: 52:54:00:0F:1C:07 for interface GigabitEthernet0/0"}
{"time":"2025-07-20T15:15:05.667917714Z","level":"INFO","msg":"worker stderr","log":"INFO:nbl_cisco_catalyst_center.ccc_diode:Added IP address entity: 10.10.20.178/24 for interface GigabitEthernet0/0"}
{"time":"2025-07-20T15:15:05.988165881Z","level":"INFO","msg":"worker stderr","log":"INFO:worker.policy.runner:Policy cisco_catalyst_center_worker: Successful ingestion"}
{"time":"2025-07-20T15:15:05.989072464Z","level":"INFO","msg":"worker stderr","log":"INFO:apscheduler.executors.default:Job \"PolicyRunner.run (trigger: cron[month='*', day='*', day_of_week='*', hour='*', minute='*'], next run at: 2025-07-20 15:16:00 UTC)\" executed successfully"}
Success Indicators: Look for the text Successful ingestion in the output, which confirms that data was successfully sent to your NetBox instance via Diode.
Testing Mode: For testing purposes, you can run the agent once and then stop it:
- Press
Ctrl+Cin your terminal to stop the agent - This is useful for verifying configuration before setting up continuous operation
Continuous Operation: The agent will continue running according to your schedule until manually stopped or the container is terminated.
View and Apply Discovered Data in NetBox Assurance
You can now work with the Catalyst Center data that has been discovered by the agent in the NetBox Assurance UI.
NetBox Assurance gives you control over operational drift by identifying deviations between your operational state and NetBox, and analytics to understand drift and plan for remediation, and ultimately take action.
Deviations are the delta between the data already in NetBox as the Network Source of Truth, versus the actual operational state of the network as discovered by the controller integration.
From an initial run of the integration it could be that ALL discovered data is a deviation as it may not have existed in NetBox previously. Once the initial sync of data has taken place, and NetBox has been updated, then further integration runs would result in new deviations only.
Accessing NetBox Assurance
- Navigate to the UI of NetBox instance
- Click on Assurance in the main navigation menu
Explore Deviation Types
- Click on Deviation Types to view the types of deviations that have been discovered
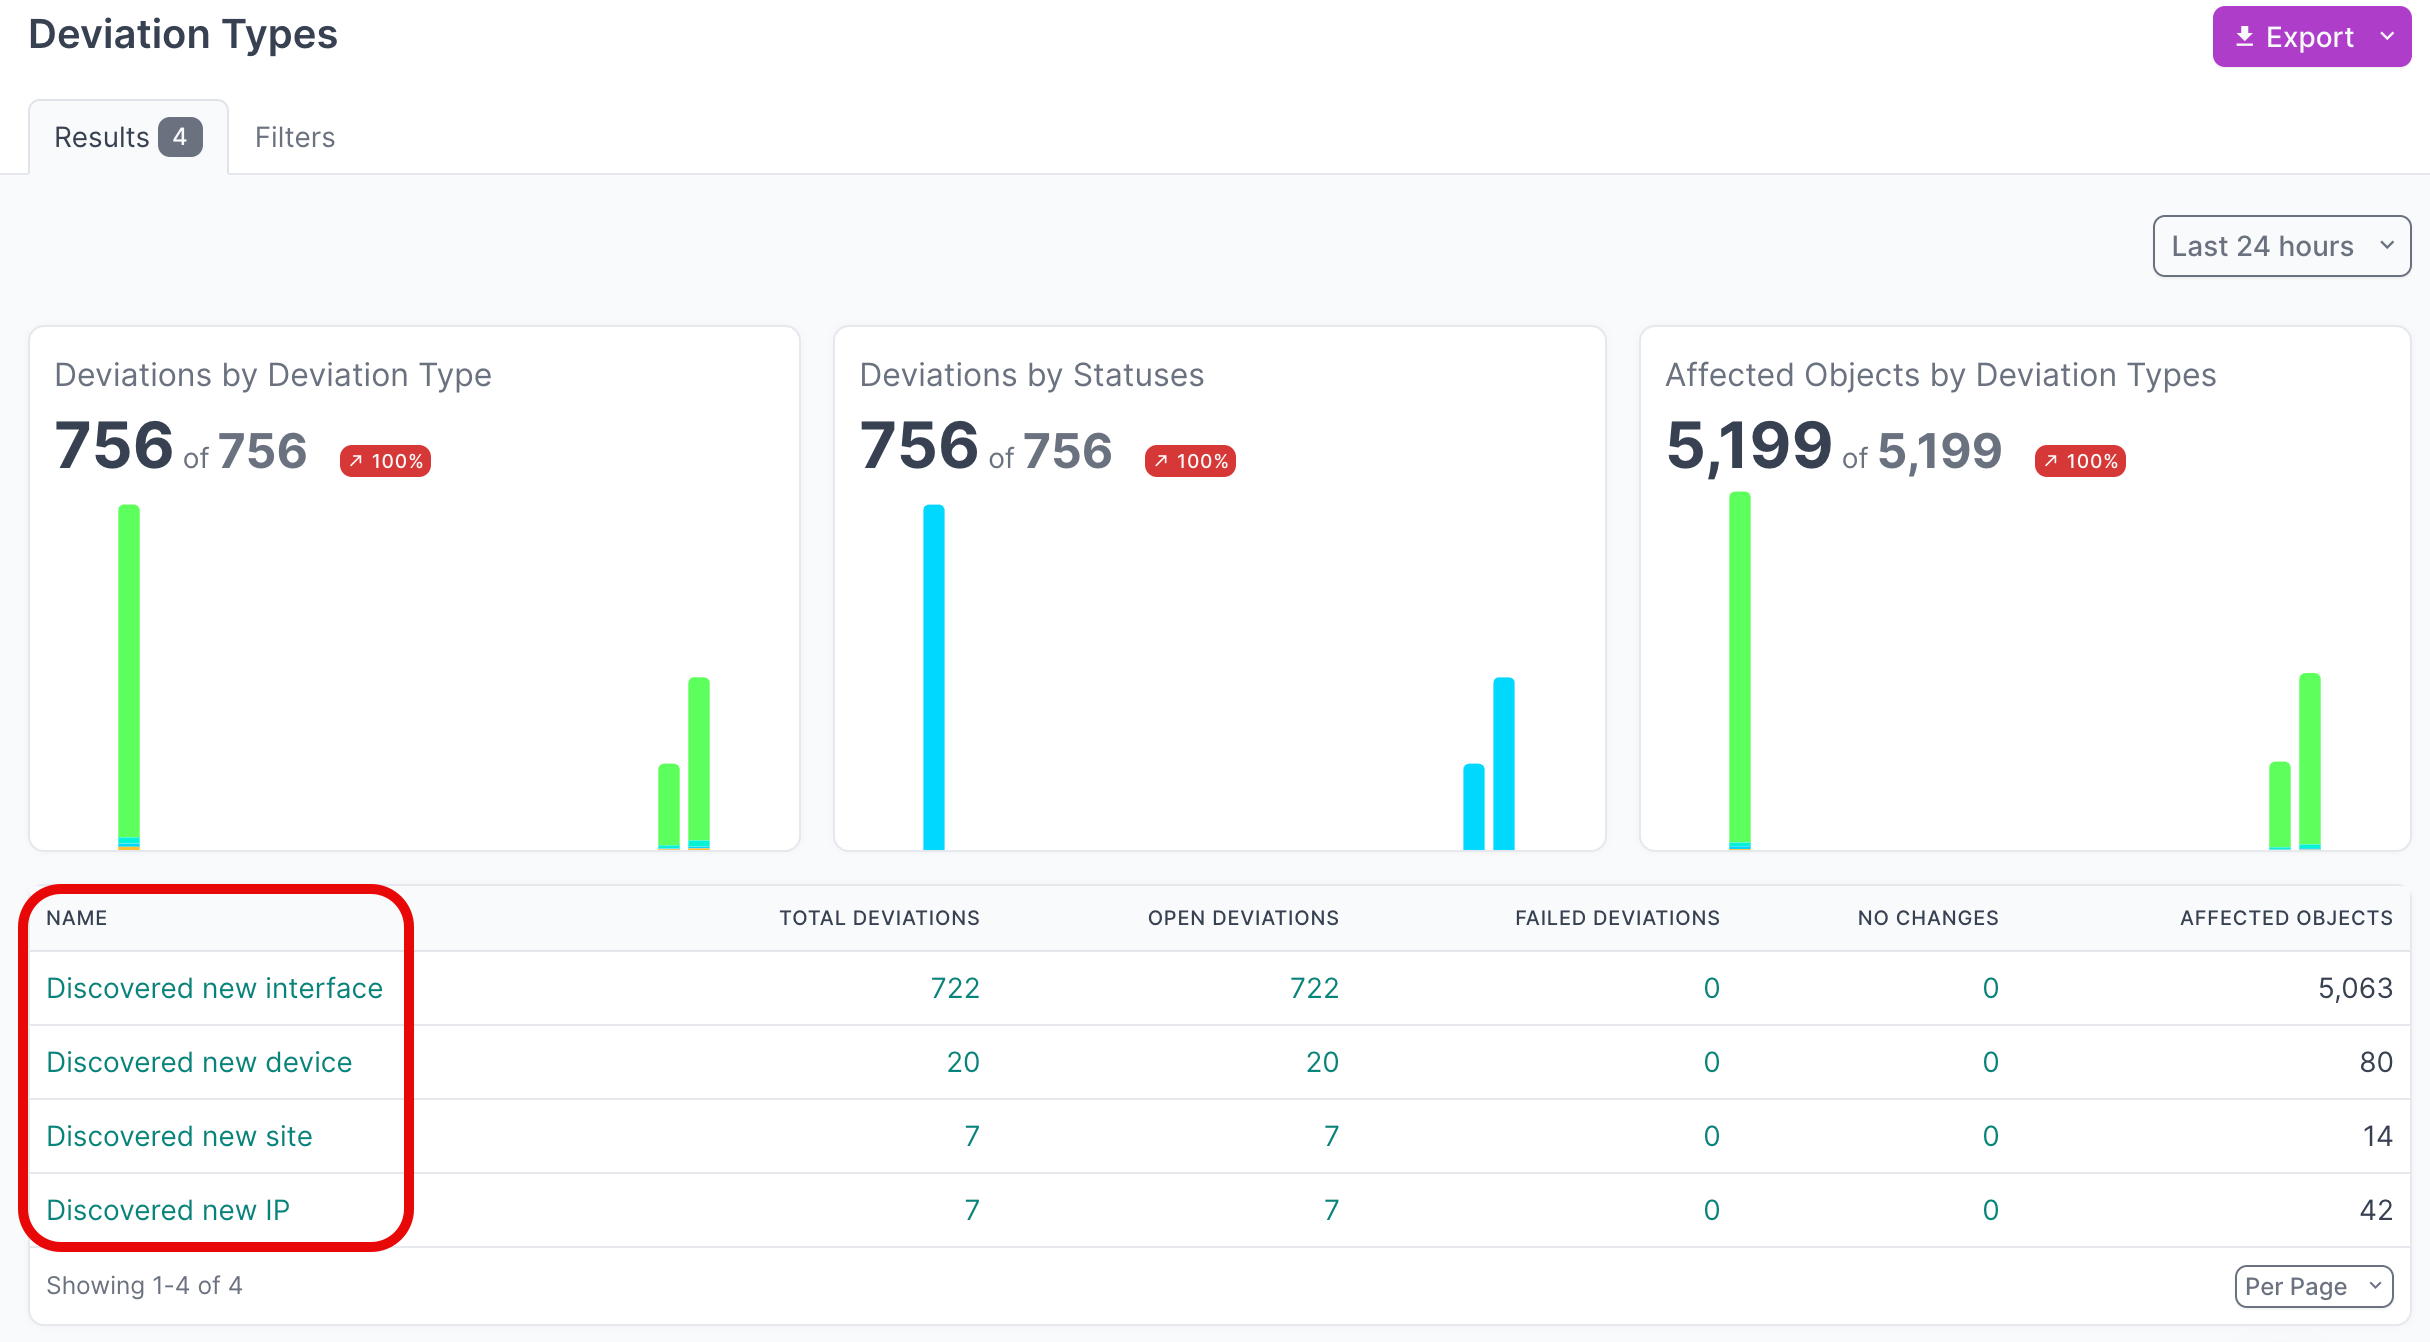
- Click on the Name of a deviation type, to view deviations for a particular type
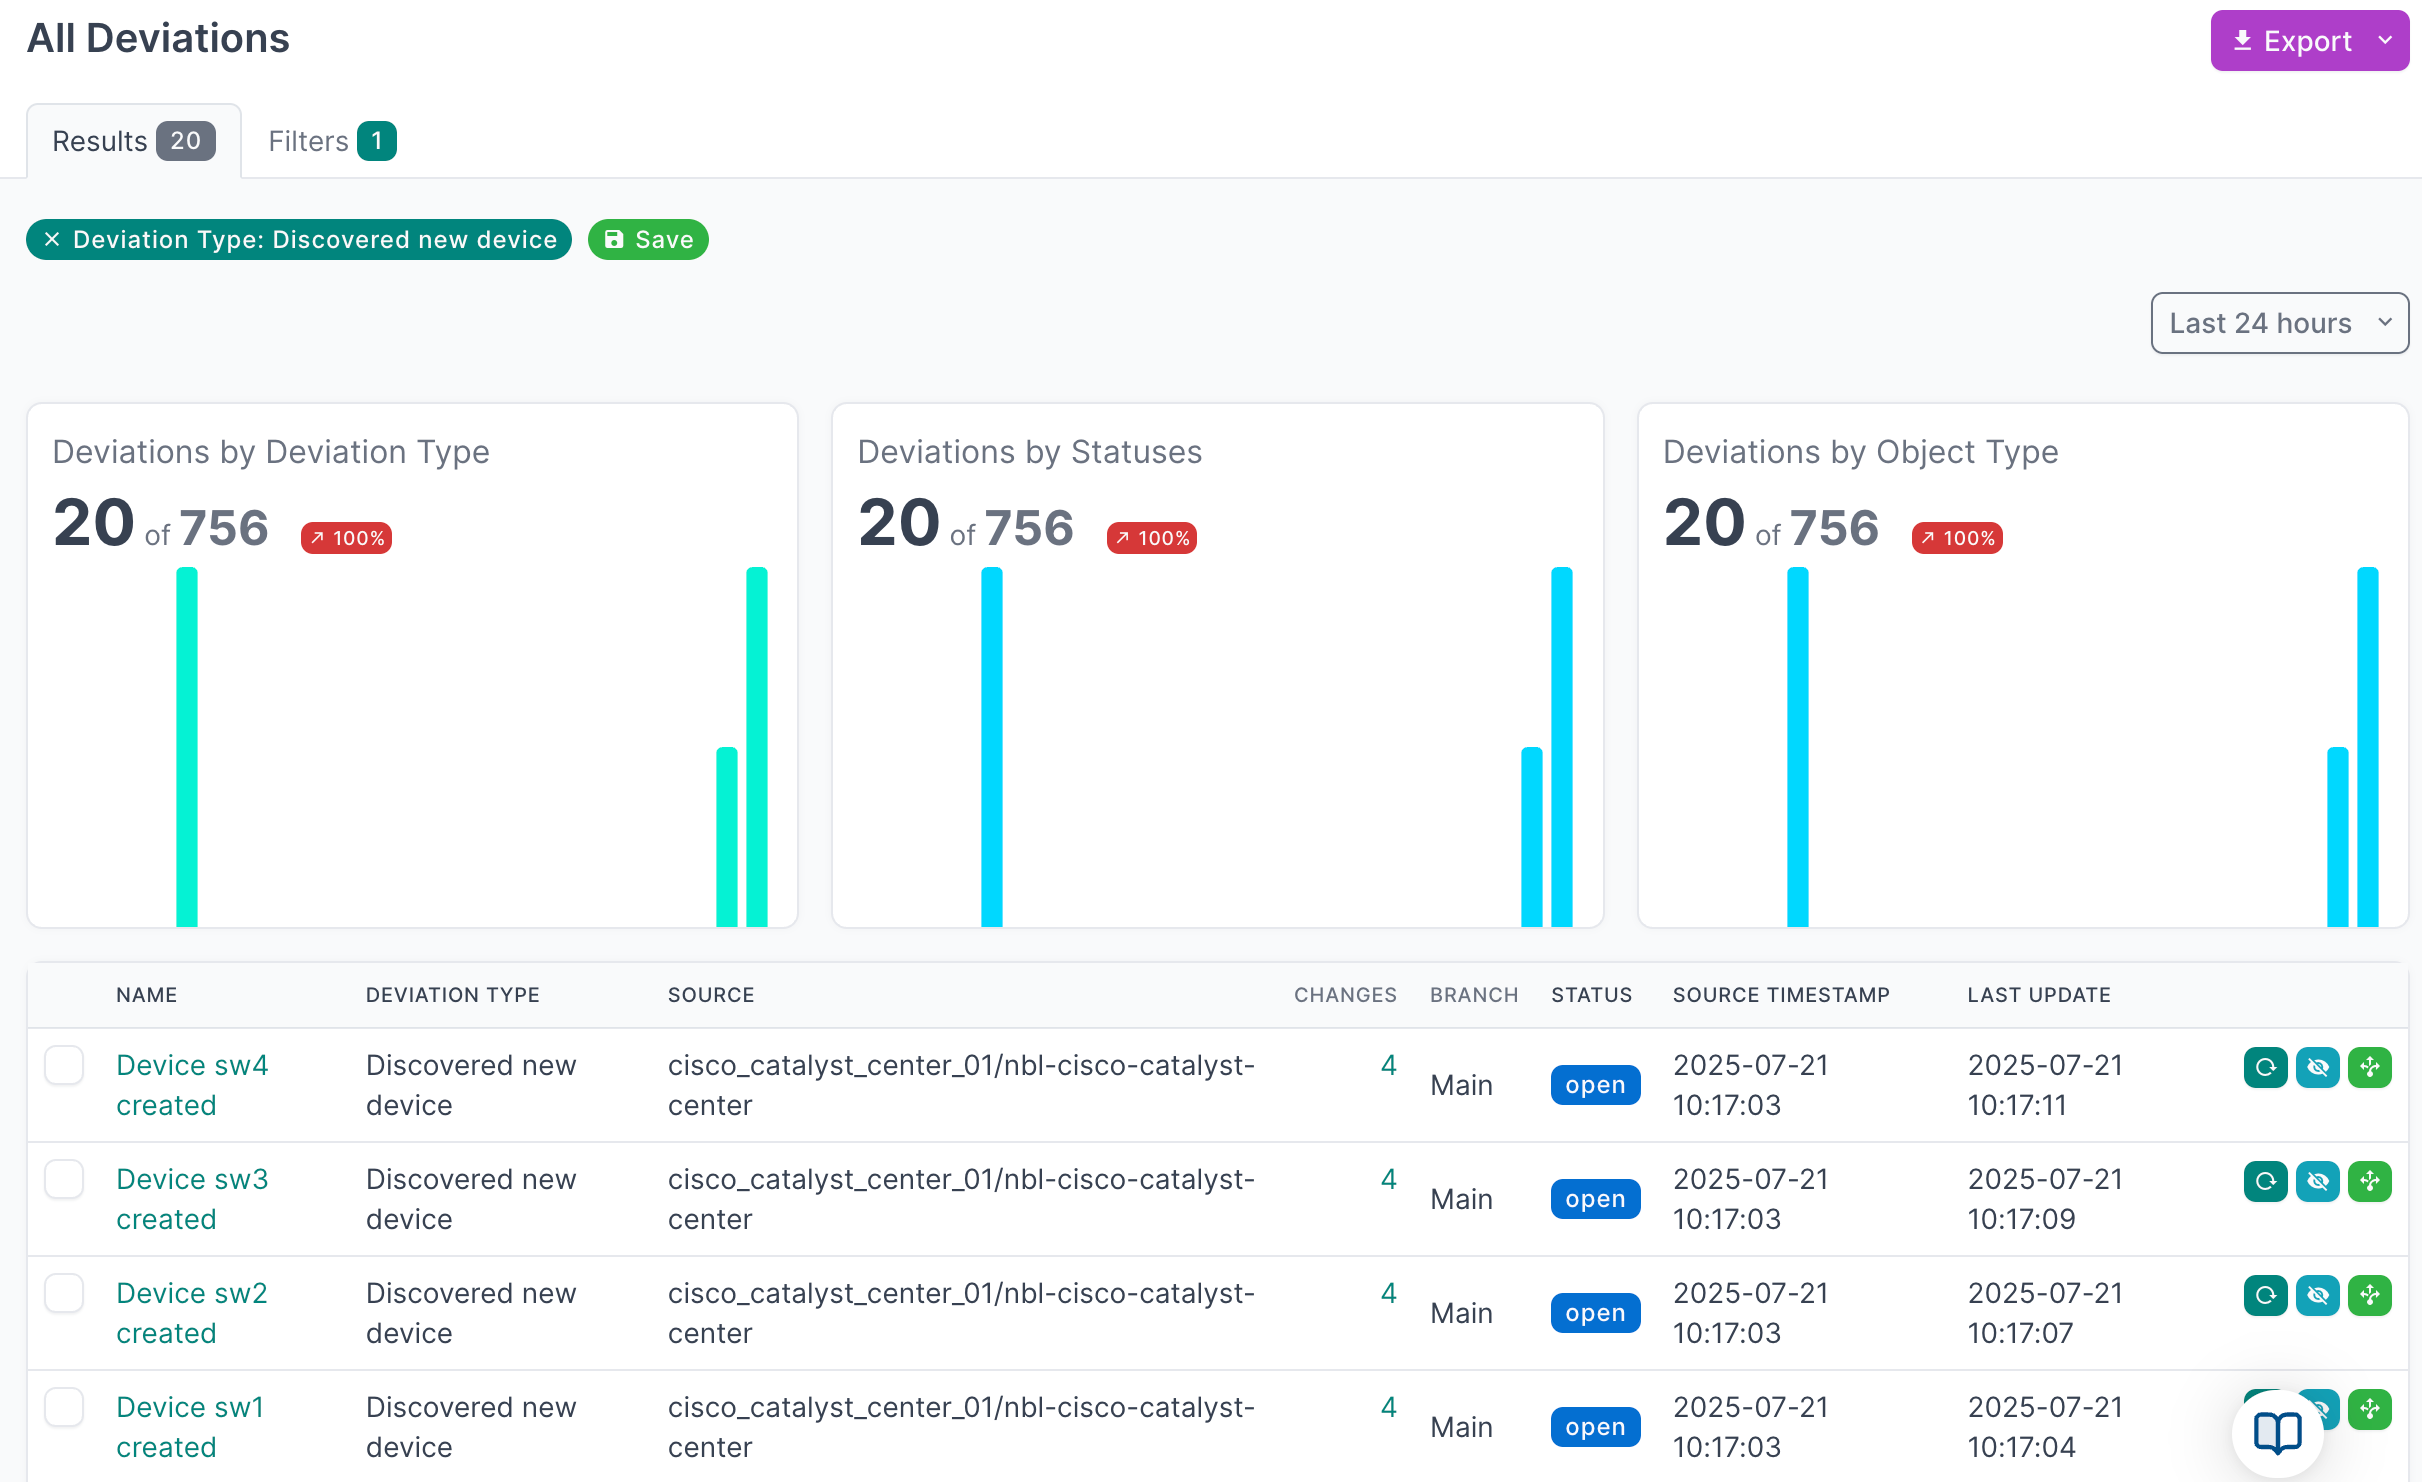
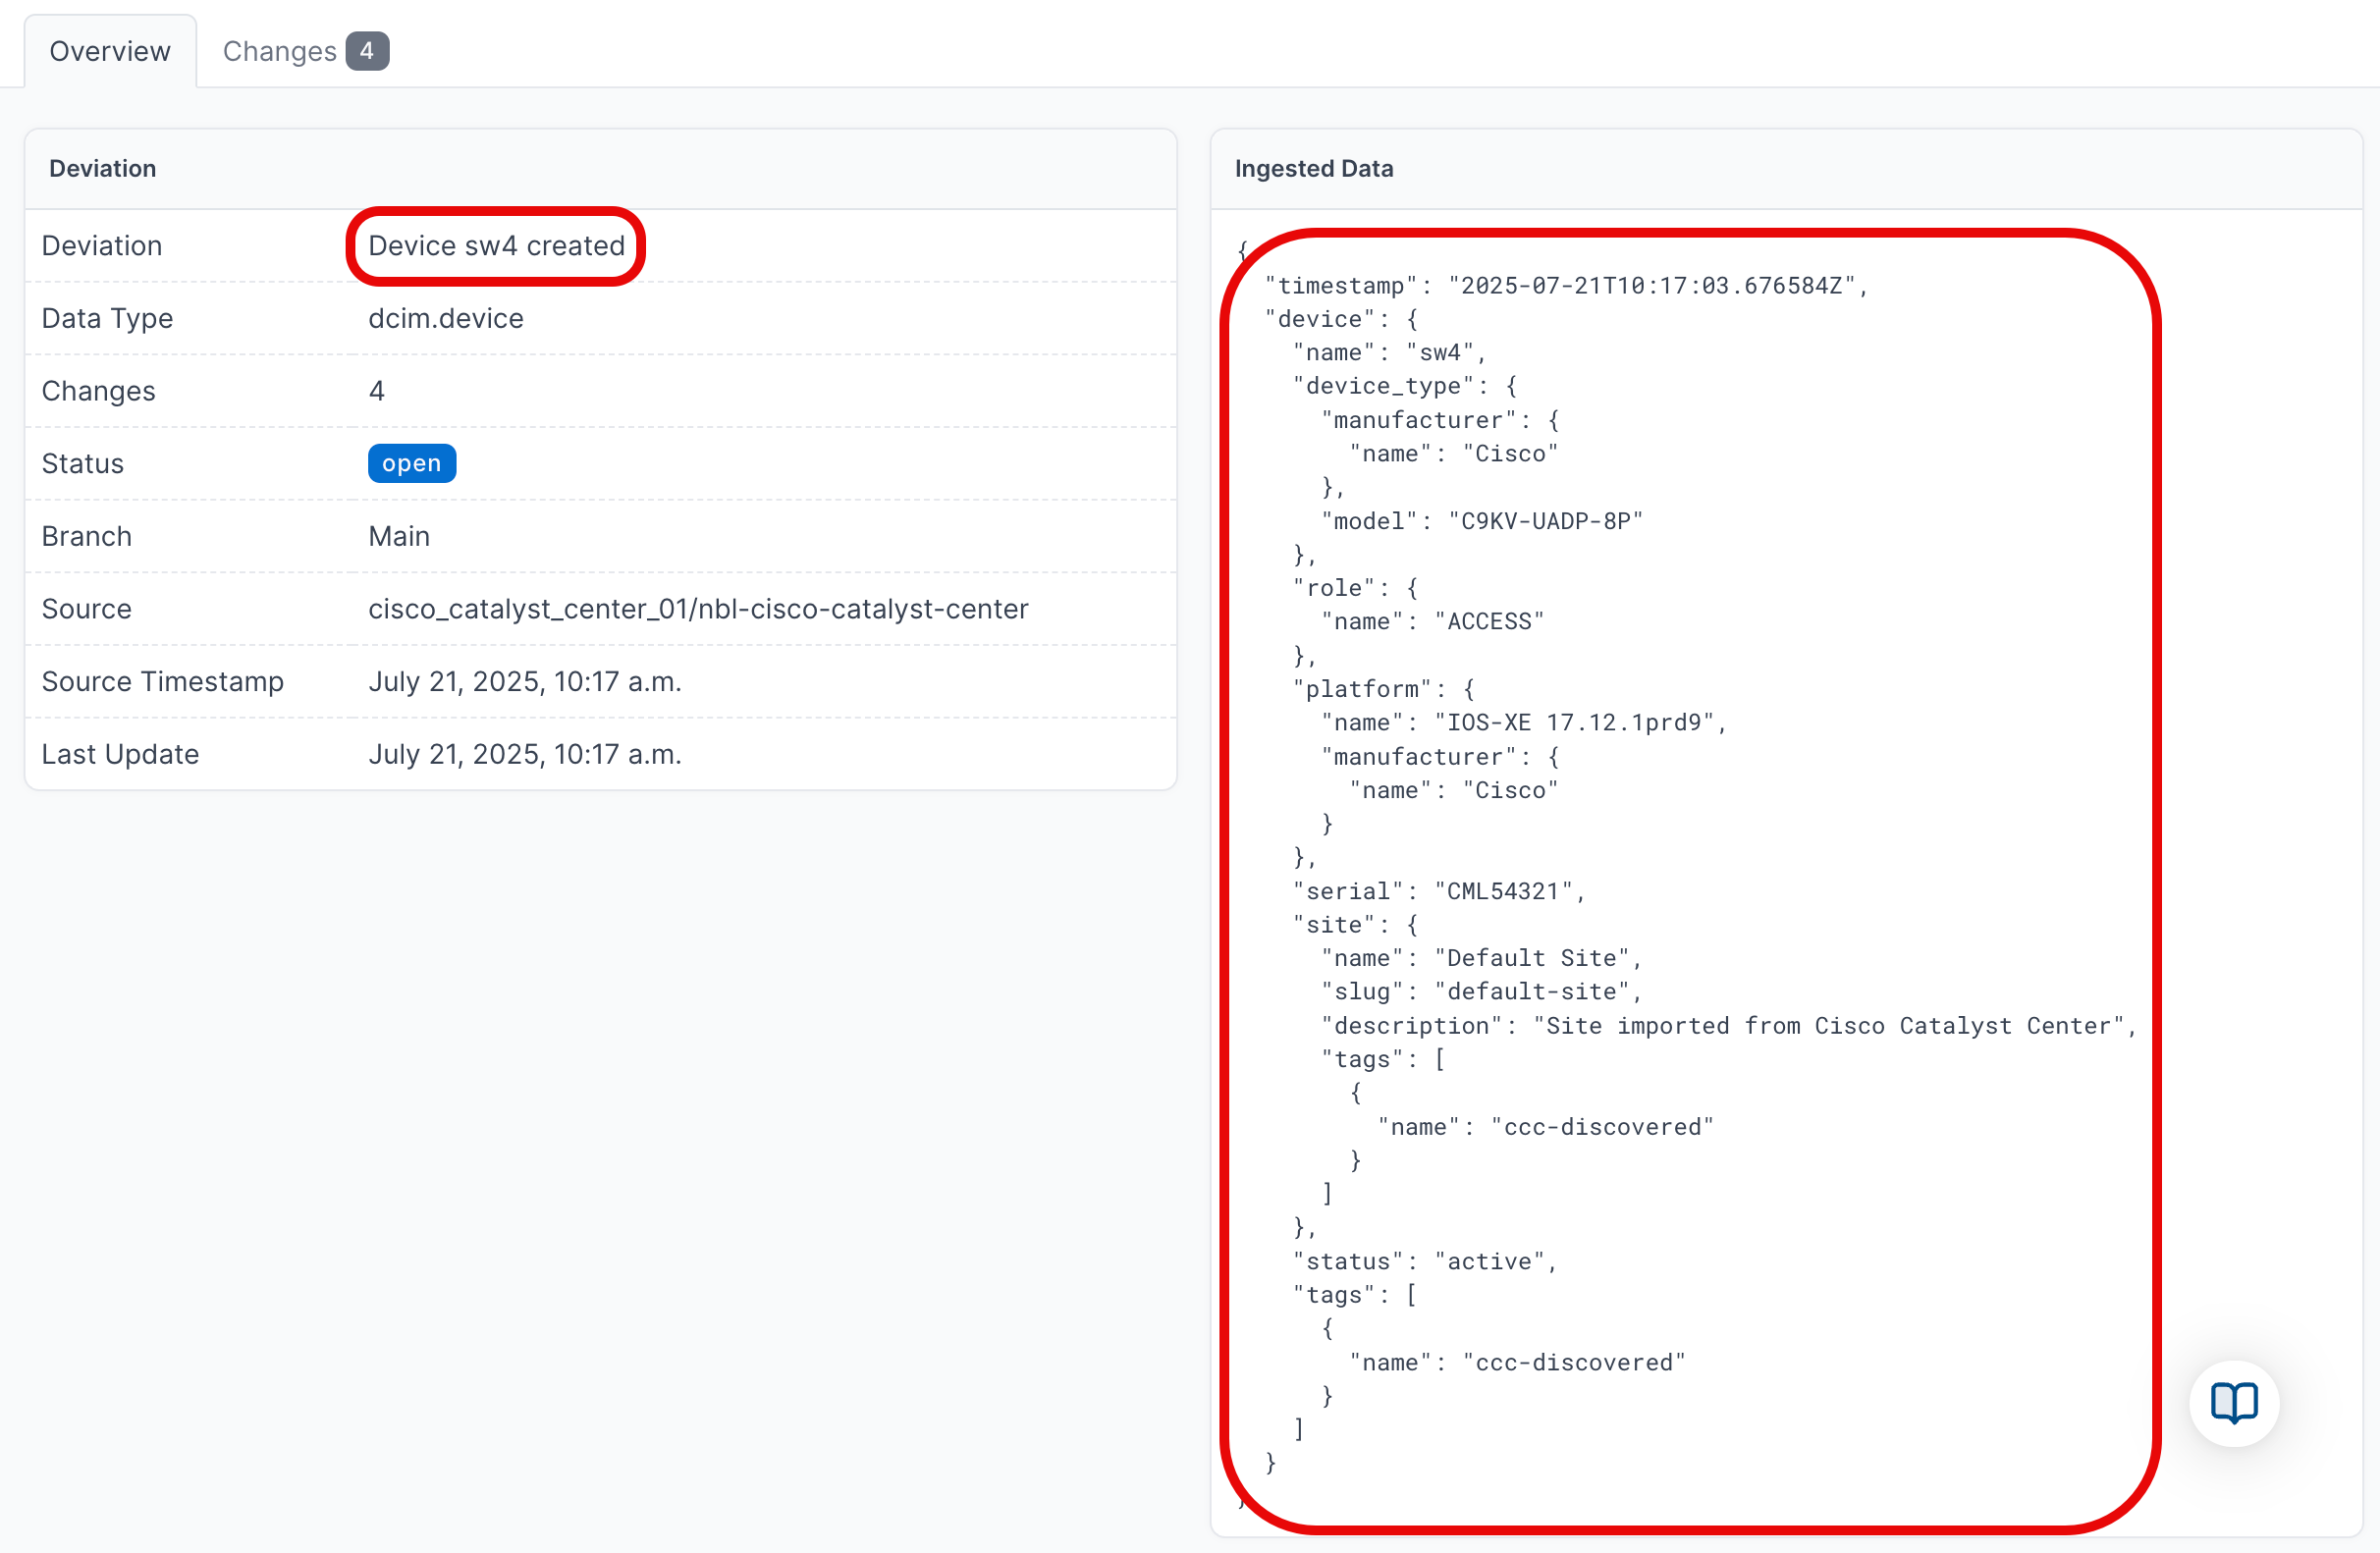
- Click on the Name of a an individual deviation, to view the details
View Active Deviations
- Click on Active Deviations to view all the deviations that have not yet been Applied or Ignored
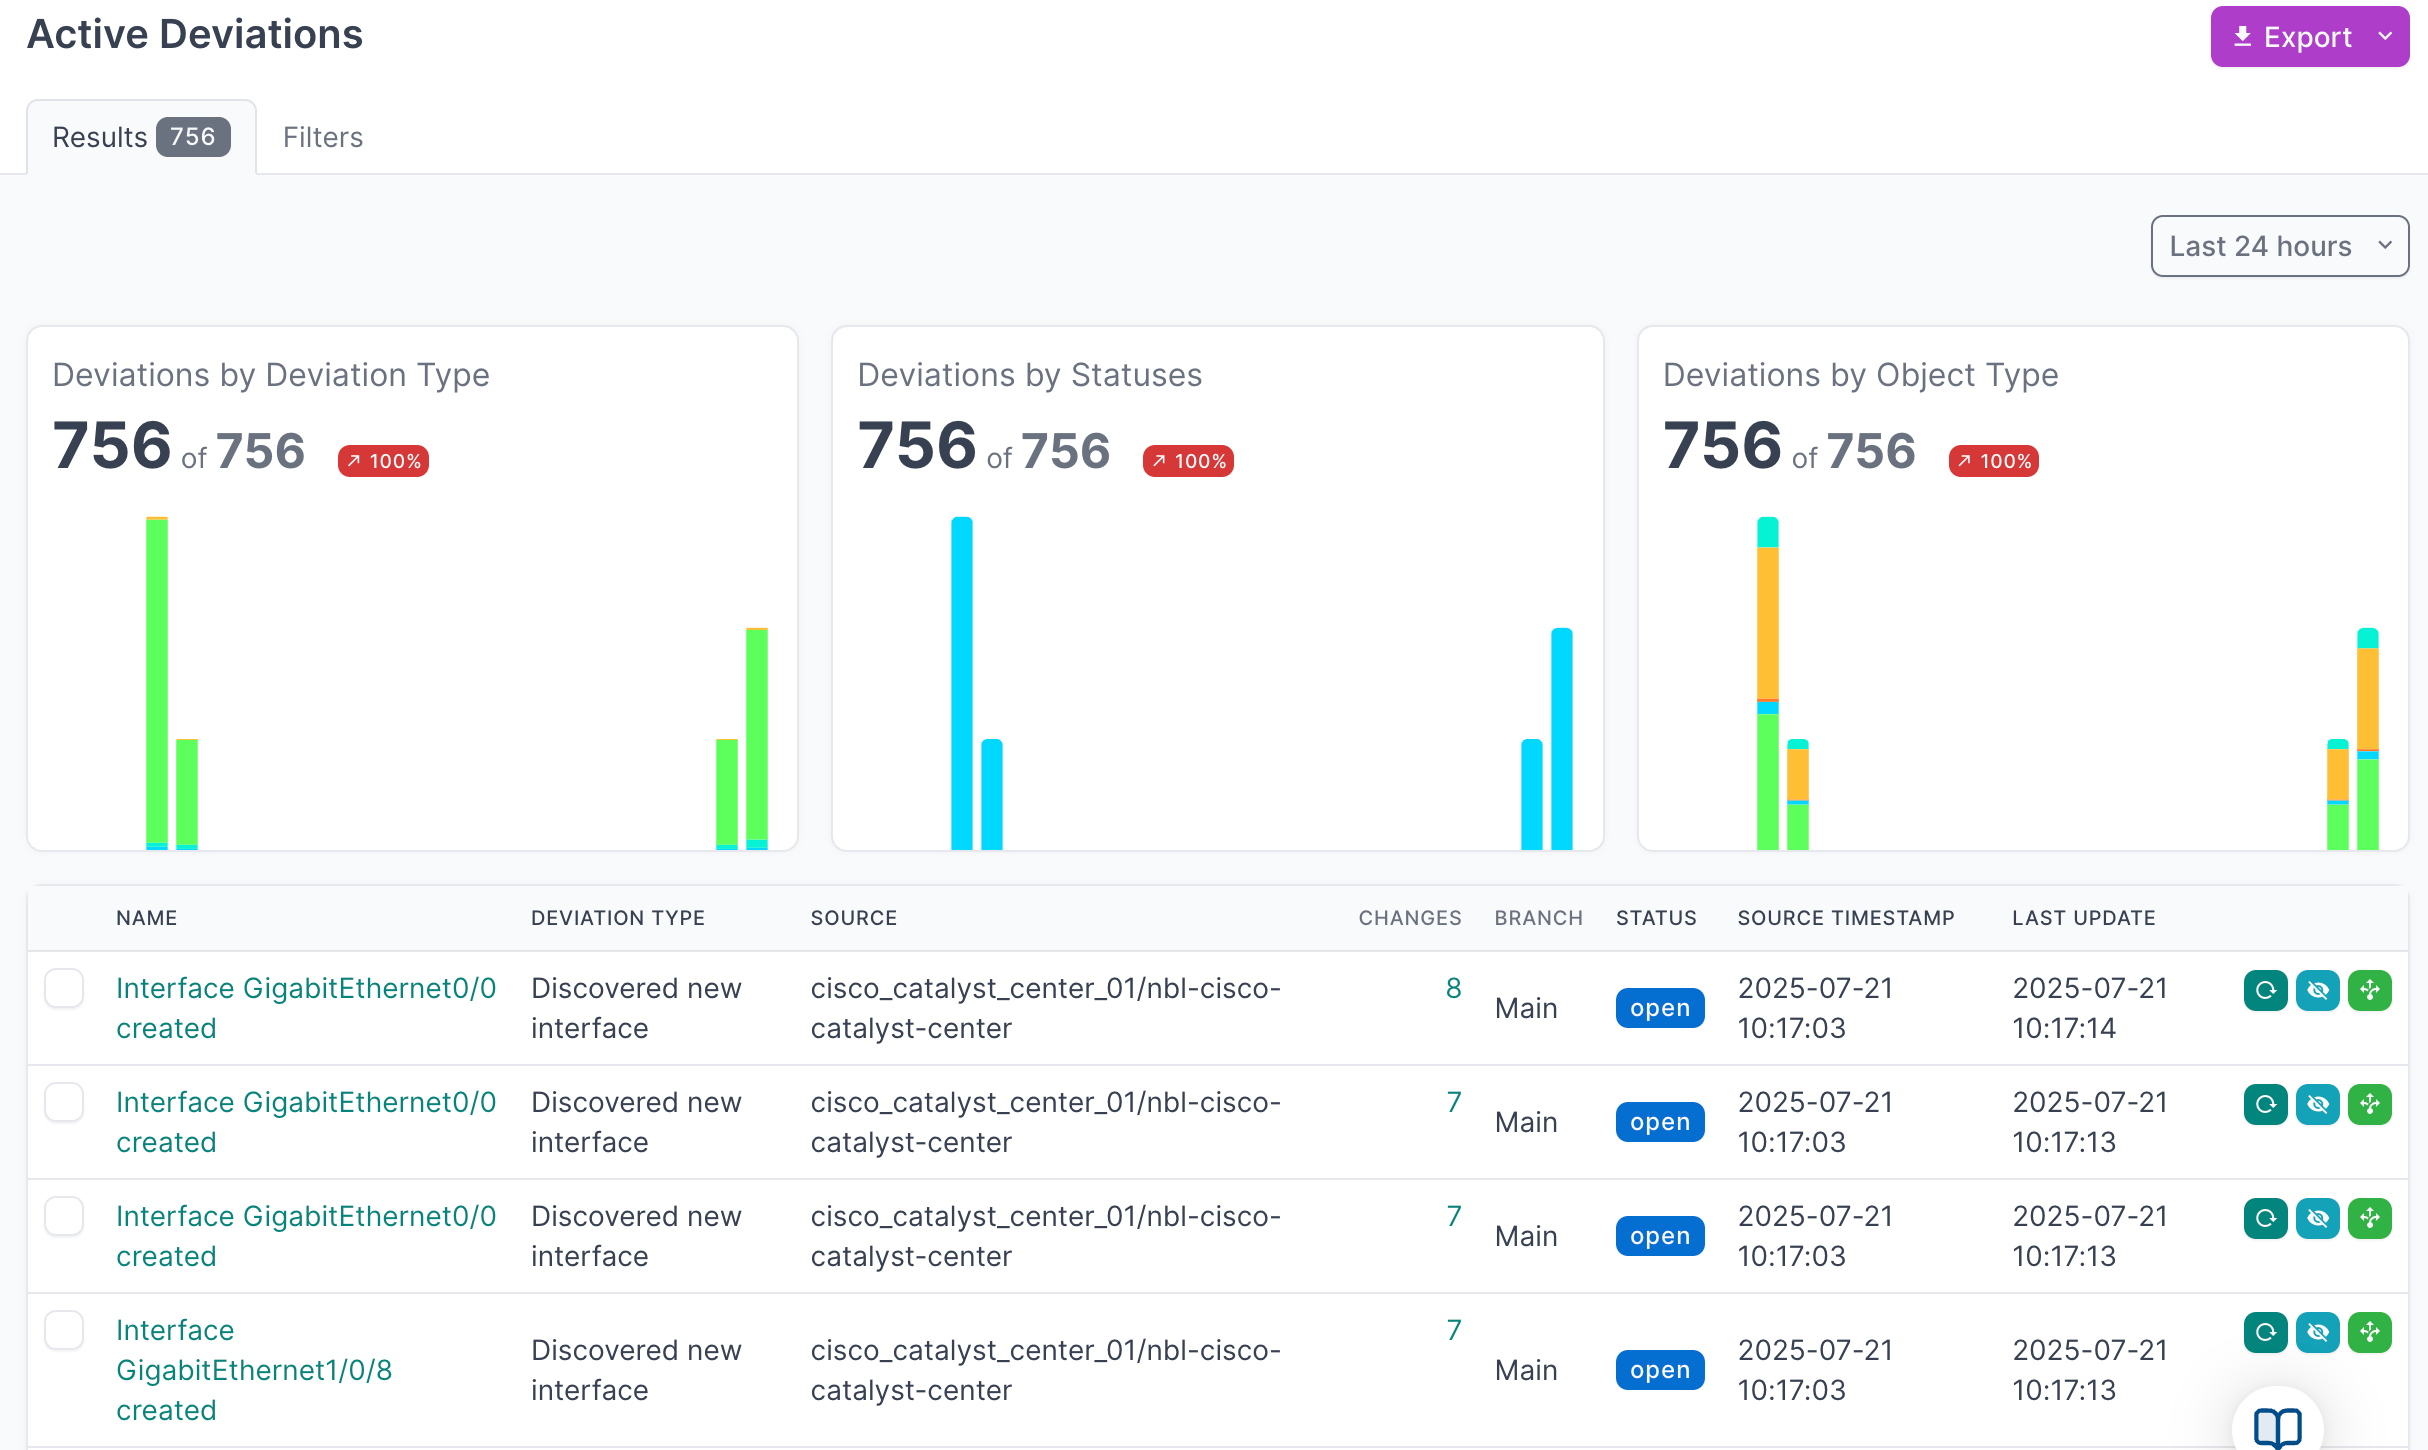
- Click on the Name of a deviation, to view the details
Apply Deviations
- Select the deviations that you'd like to apply, and then click Apply:
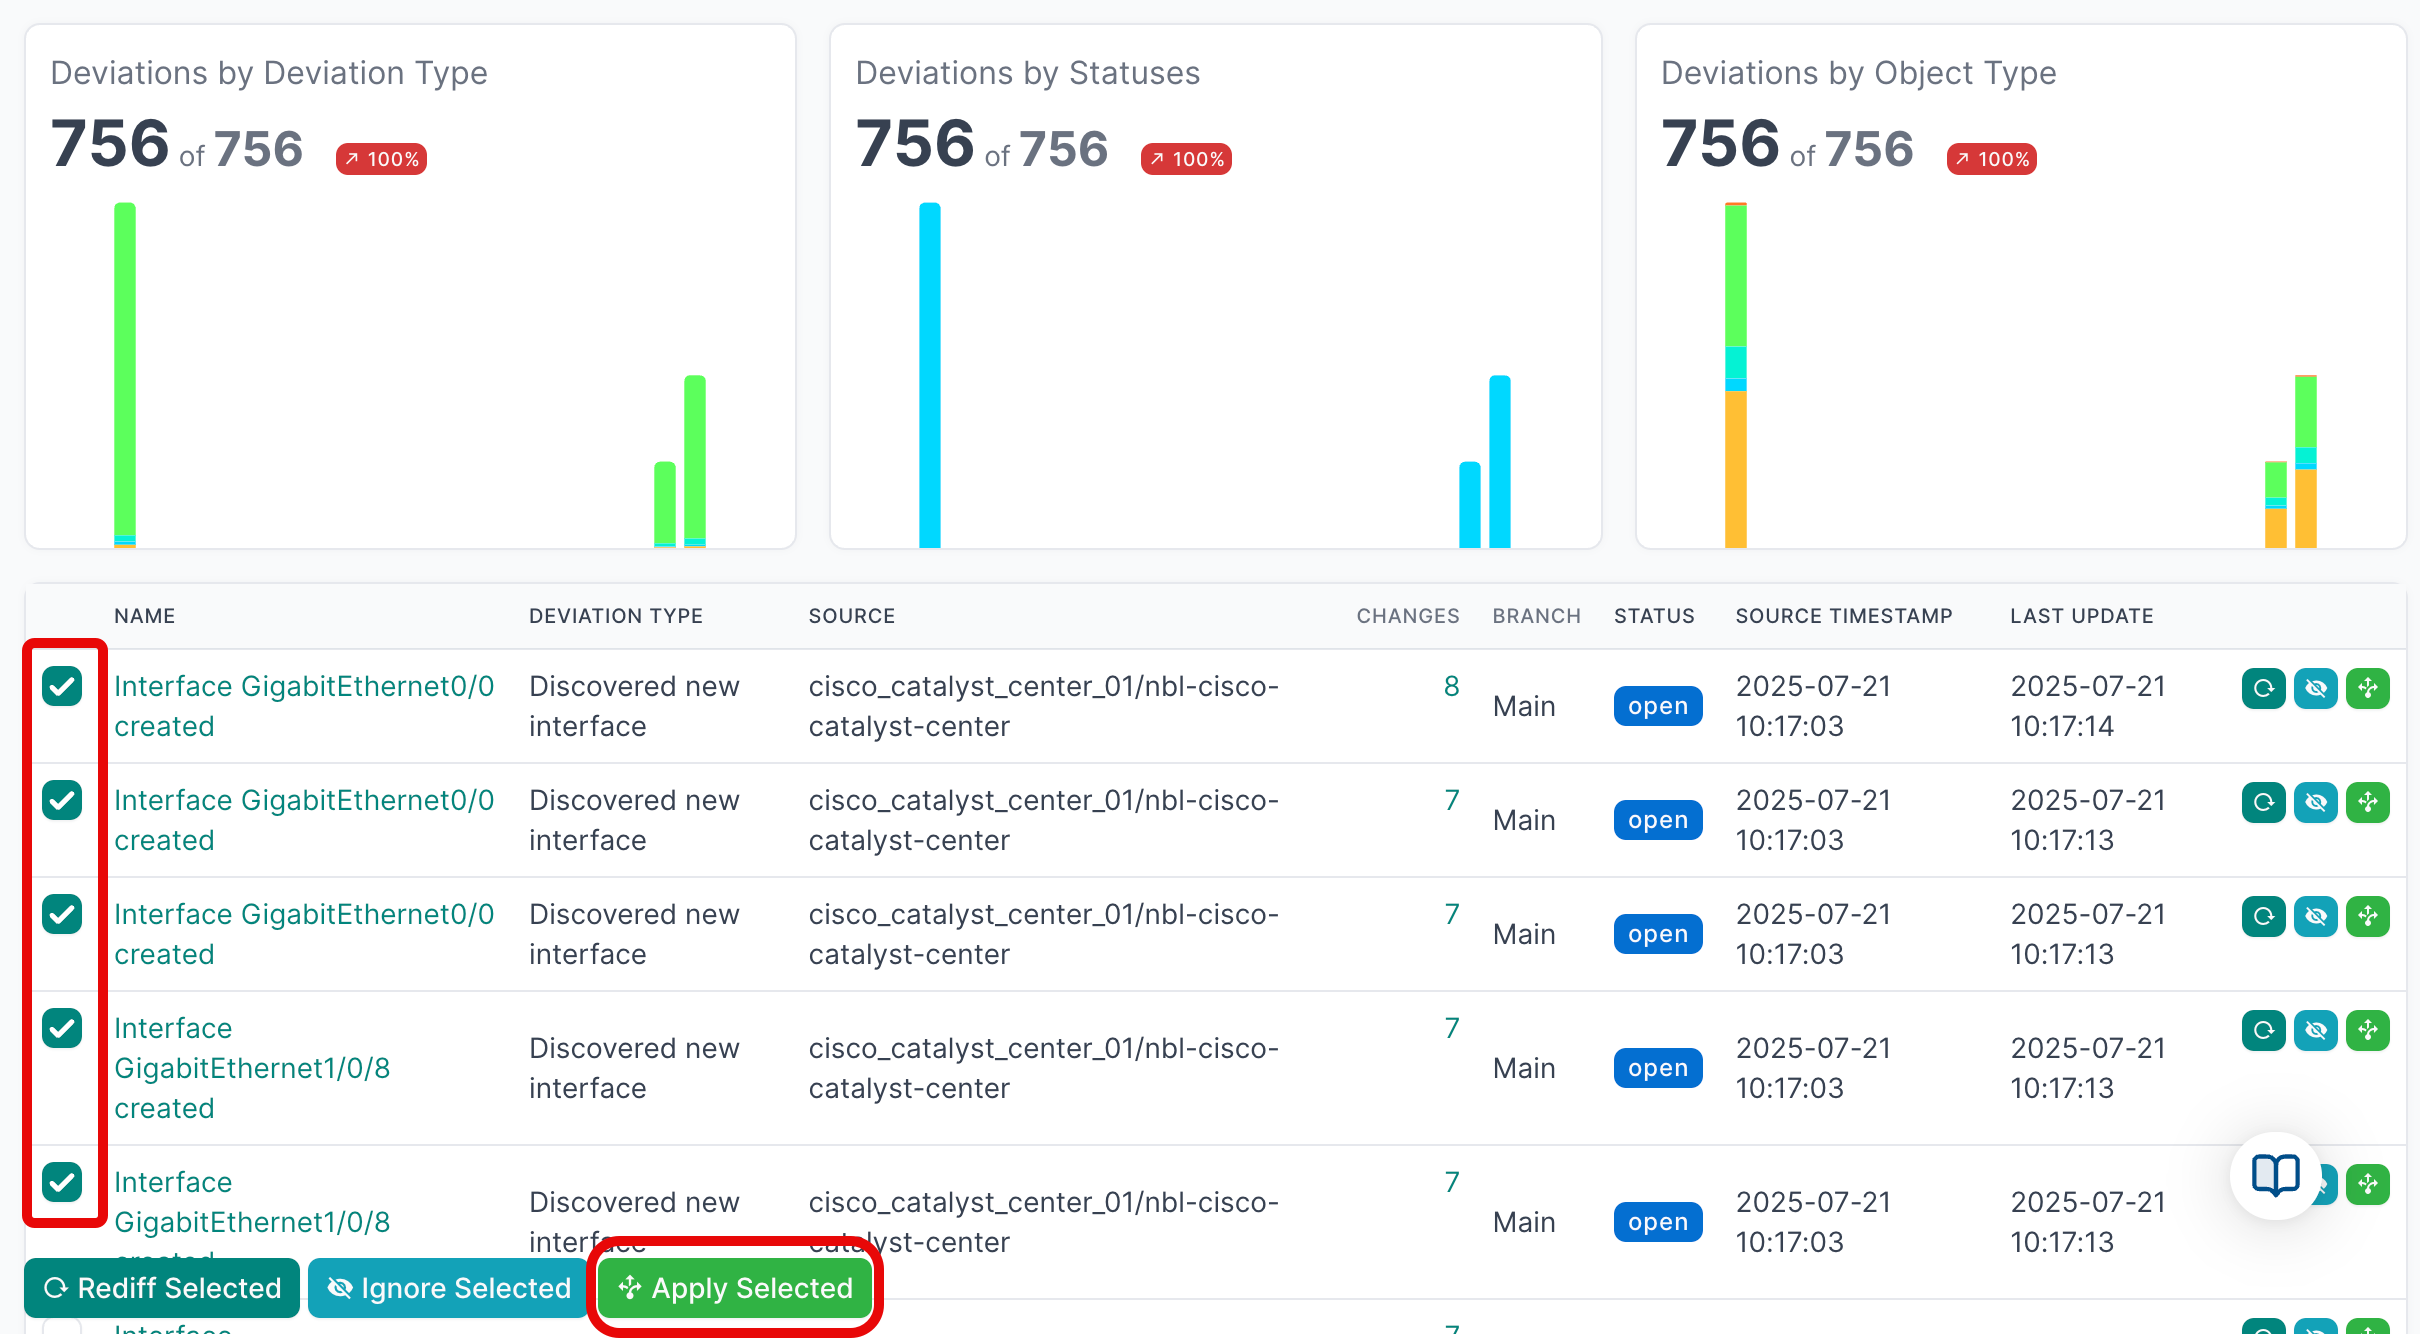
- Click Apply X Deviations to apply the deviations to the NetBox database:
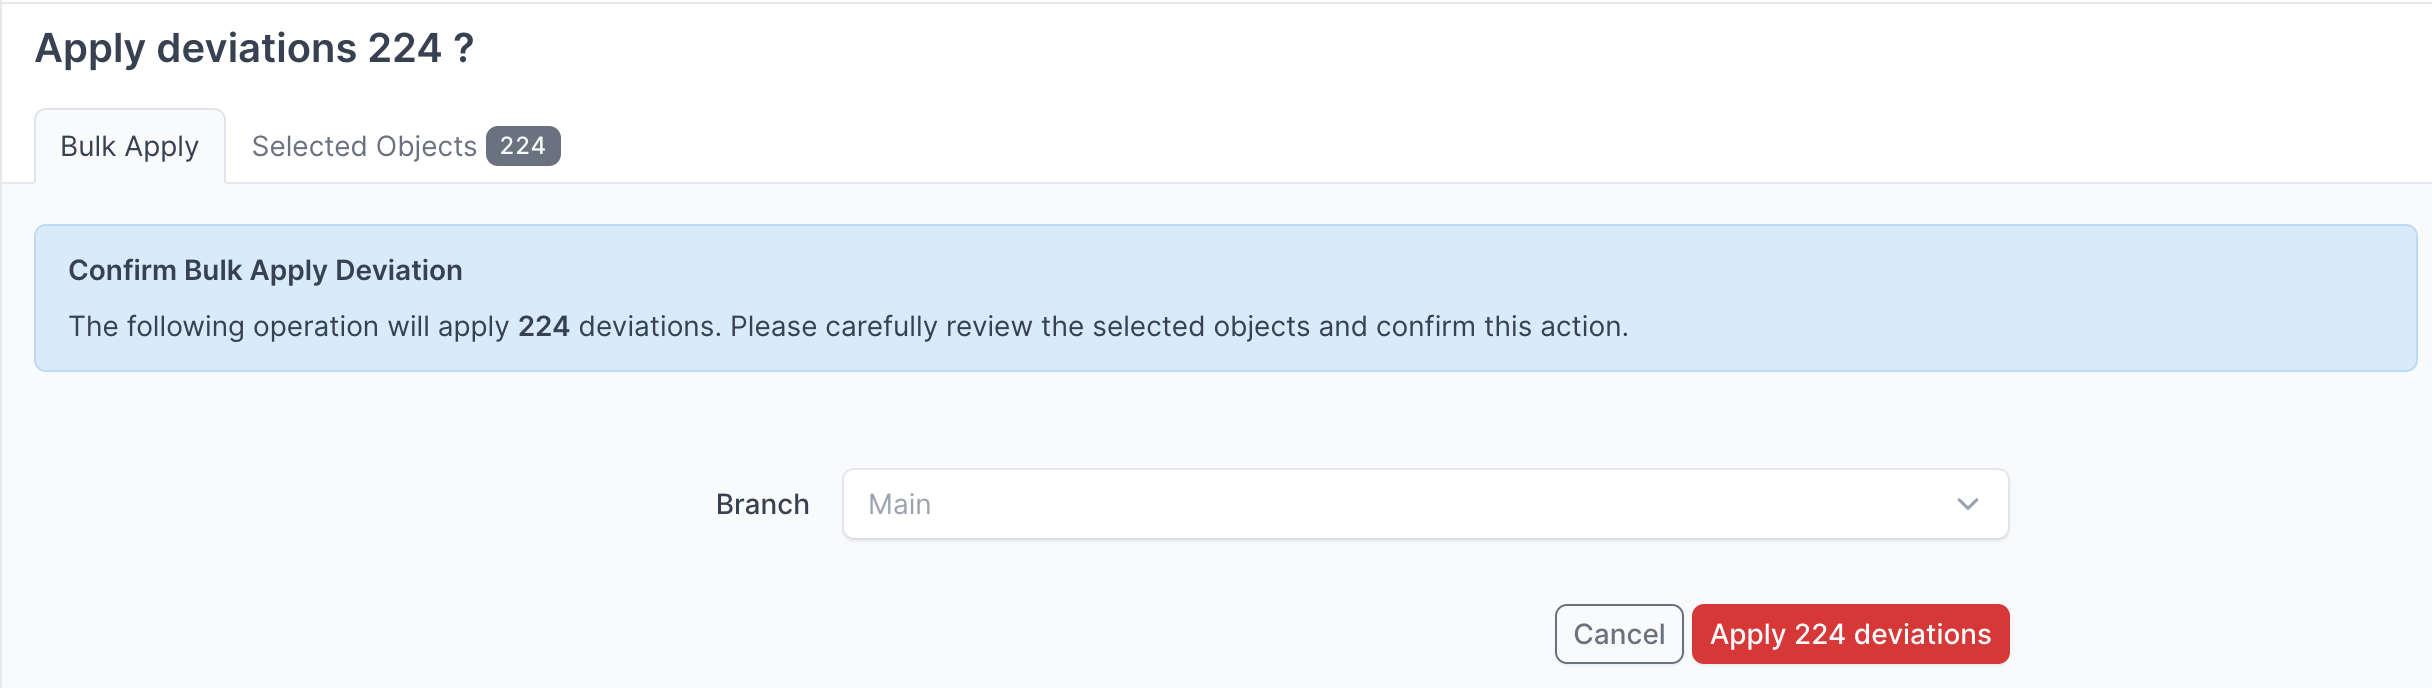
Instead of writing the deviations to the Main NetBox database branch, you can select another branch from the drop down menu and apply the deviations to that branch.
For more detailed information on working with NetBox Assurance, please refer to the documentation
View the Cisco Catalyst Center Data in NetBox
Now that you have run the integration at least once and applied the discovered data, you can view the data in the NetBox UI
- Start by clicking on Devices in the main navigation menu
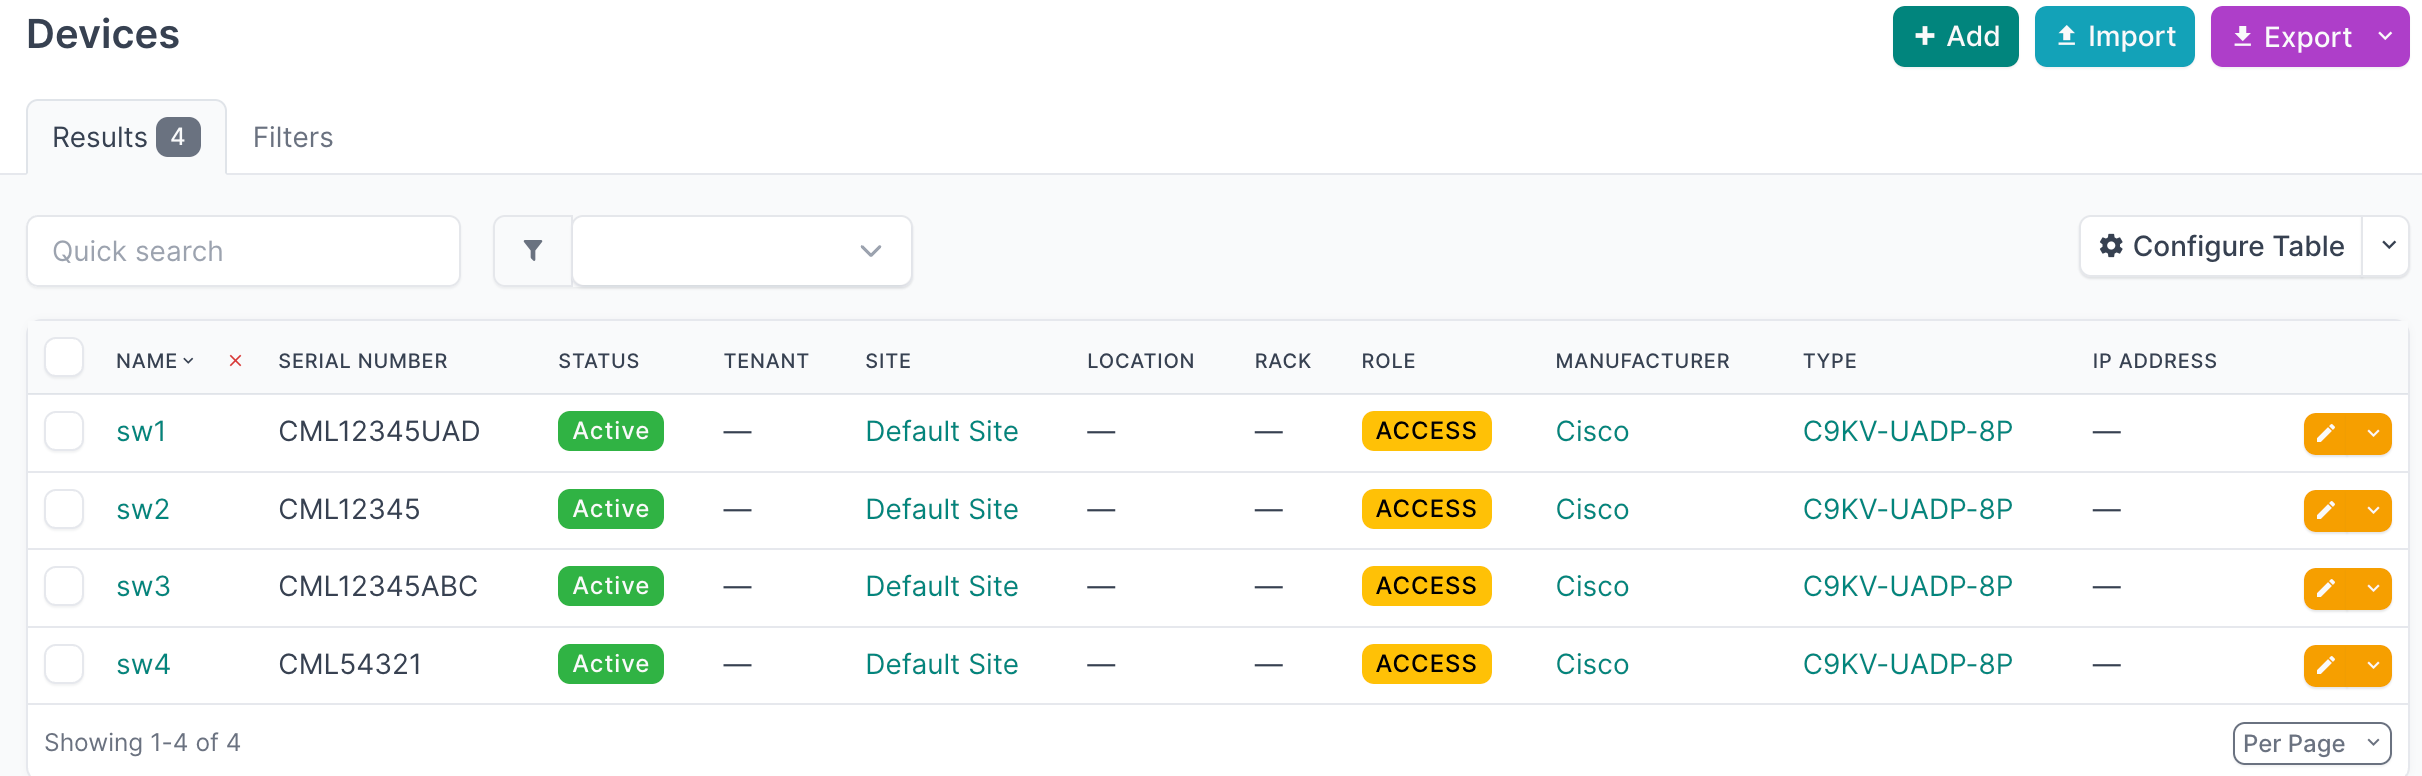
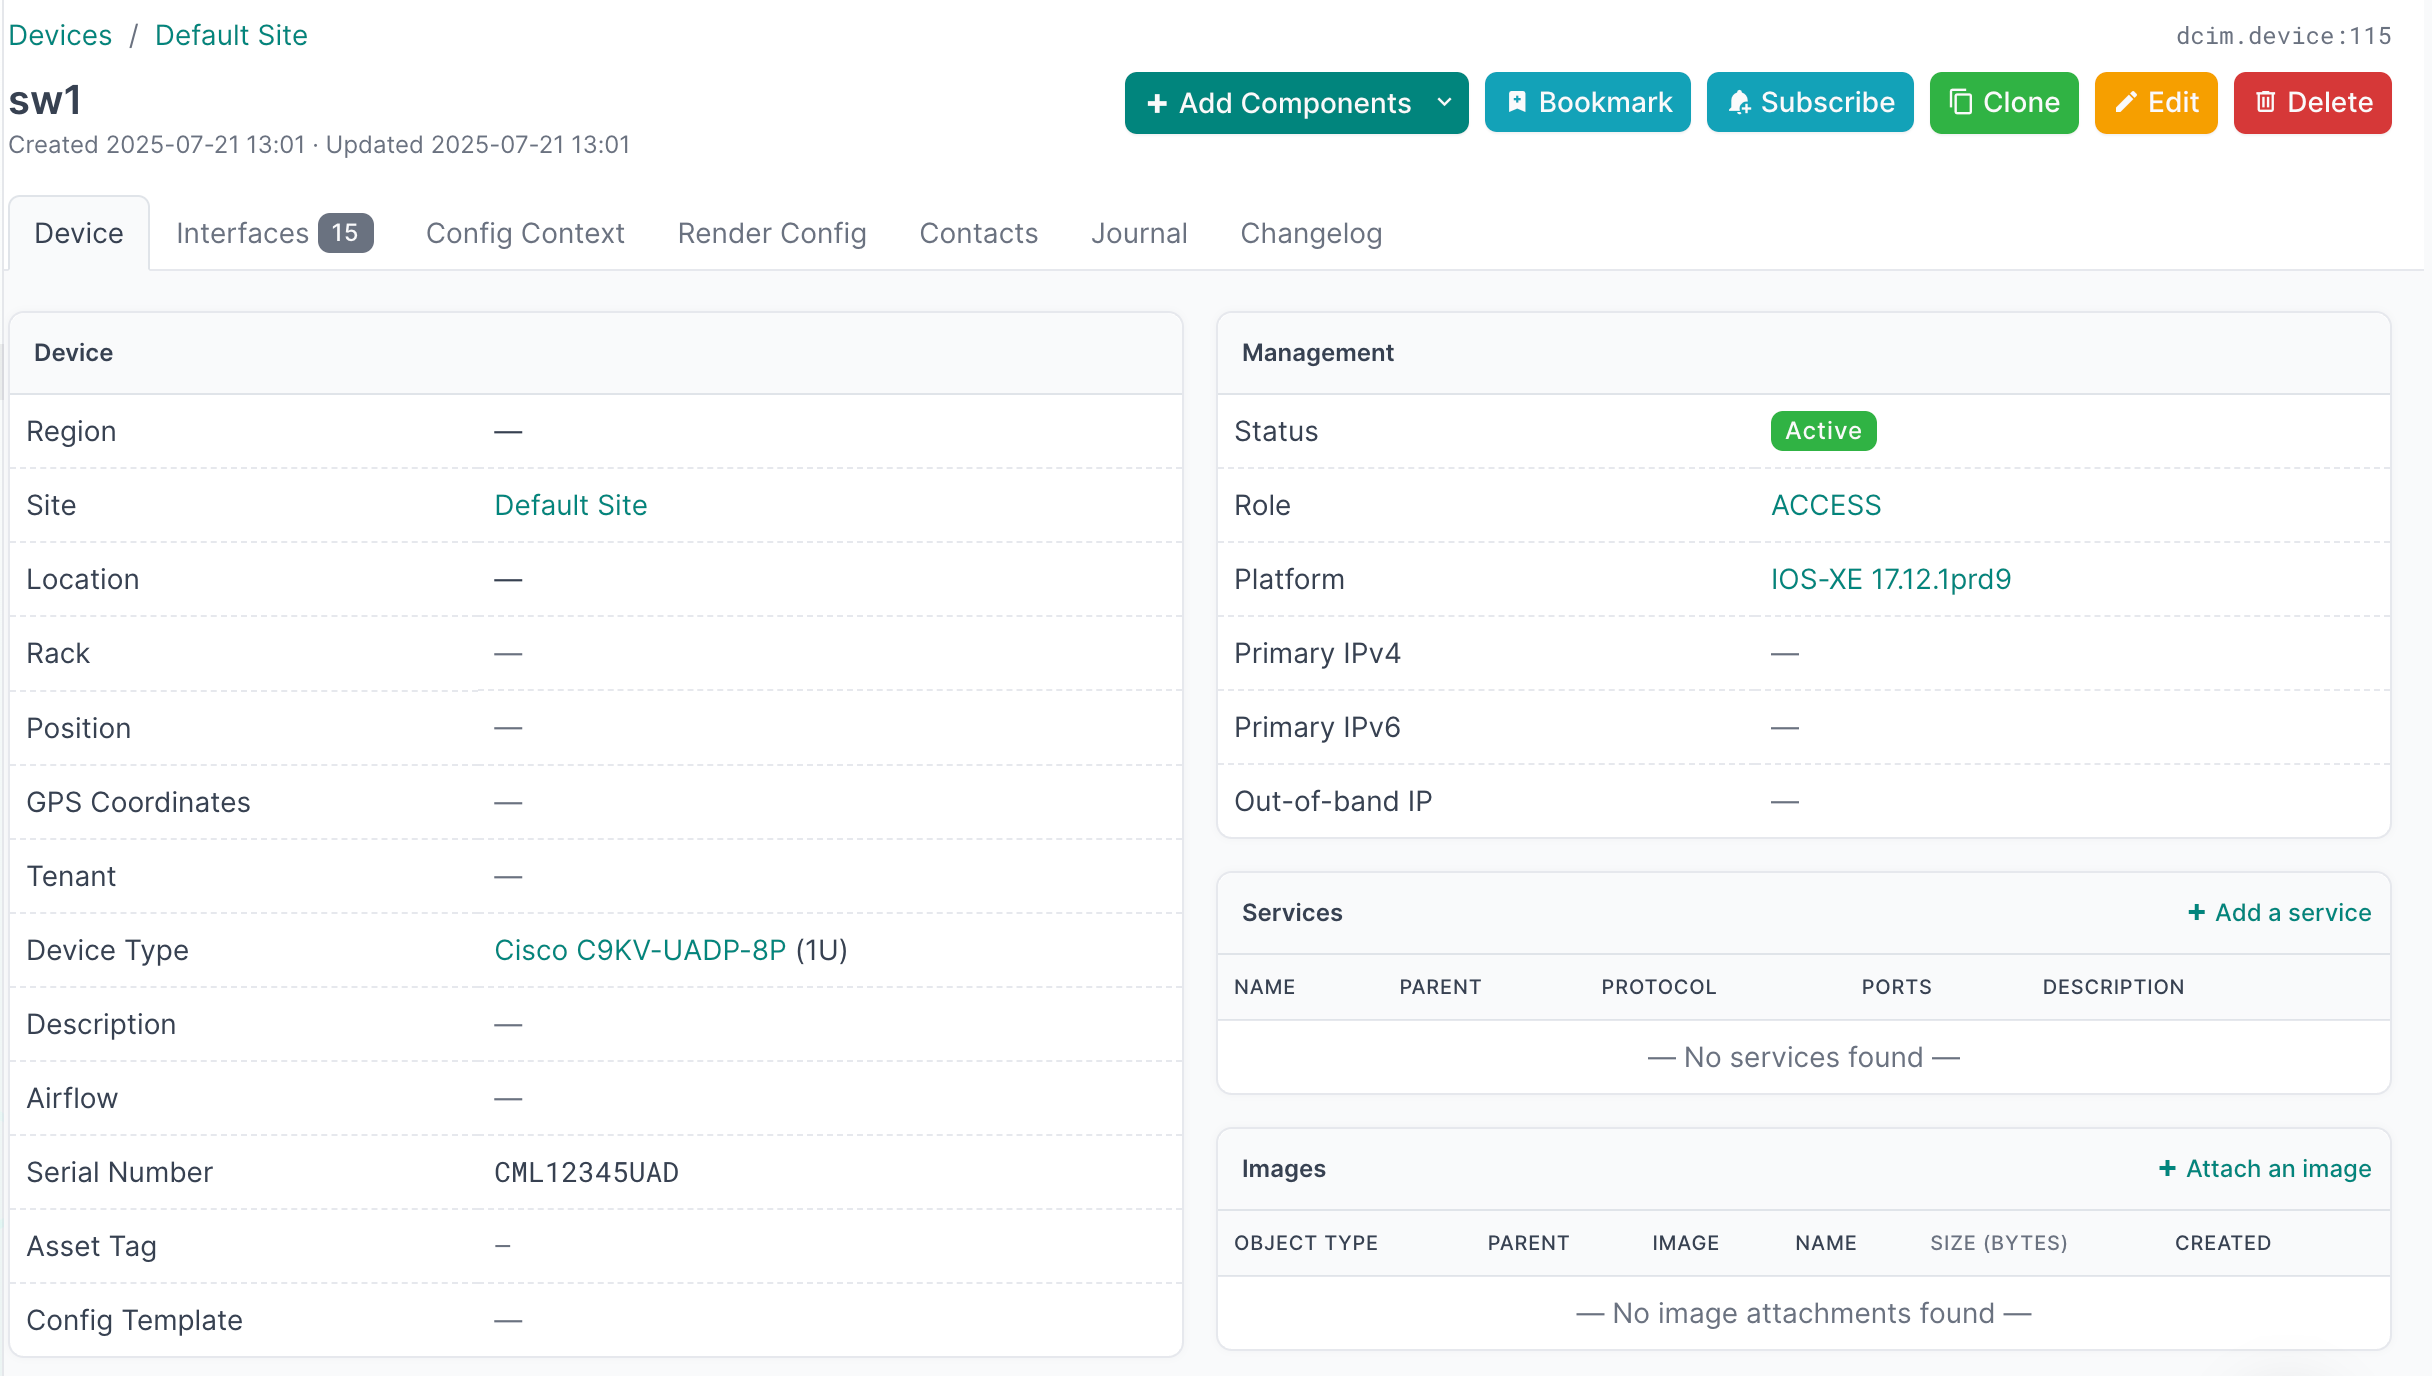
- Select an individual device to view the details
Additional Resources
Related Documentation
Support
Email support@netboxlabs.com for support.