NetBox Visual Explorer
Visual Explorer turns the infrastructure you document in NetBox into interactive visualizations - floorplans, rack elevations, power chains, cable and network topologies, IPAM maps, and a geographic WAN view. It lives in the NetBox Labs Console alongside your NetBox instances and reads directly from the NetBox you already maintain.
There is nothing to model twice. When your team updates NetBox - racking a device, documenting a cable, allocating a prefix - Visual Explorer reflects the change the next time the view loads.
How it works
Visual Explorer reads your NetBox system of record, not the live network. That makes it a different kind of tool than monitoring: it shows you what you have and how it is organized - where equipment sits, how power flows, what connects to what, and how your address space is laid out. Most teams use it alongside their observability stack, not instead of it.
Every view is scoped and interactive:
- Scope to a site (and where relevant, a location or rack) with the selector at the top of every view. Your whole organization is never rendered as one hairball.
- Click anything - a rack, a device, a feed, an outlet, a prefix - to open a details panel with its key attributes, relationships, and a direct View in NetBox link for editing.
- Share what you see. Each view encodes its state in the URL, so a link to a specific site's power chain or a filtered topology lands your colleague on exactly what you were looking at. Views can also be embedded directly in wikis, runbooks, and dashboards.
The views
| View | What it answers |
|---|---|
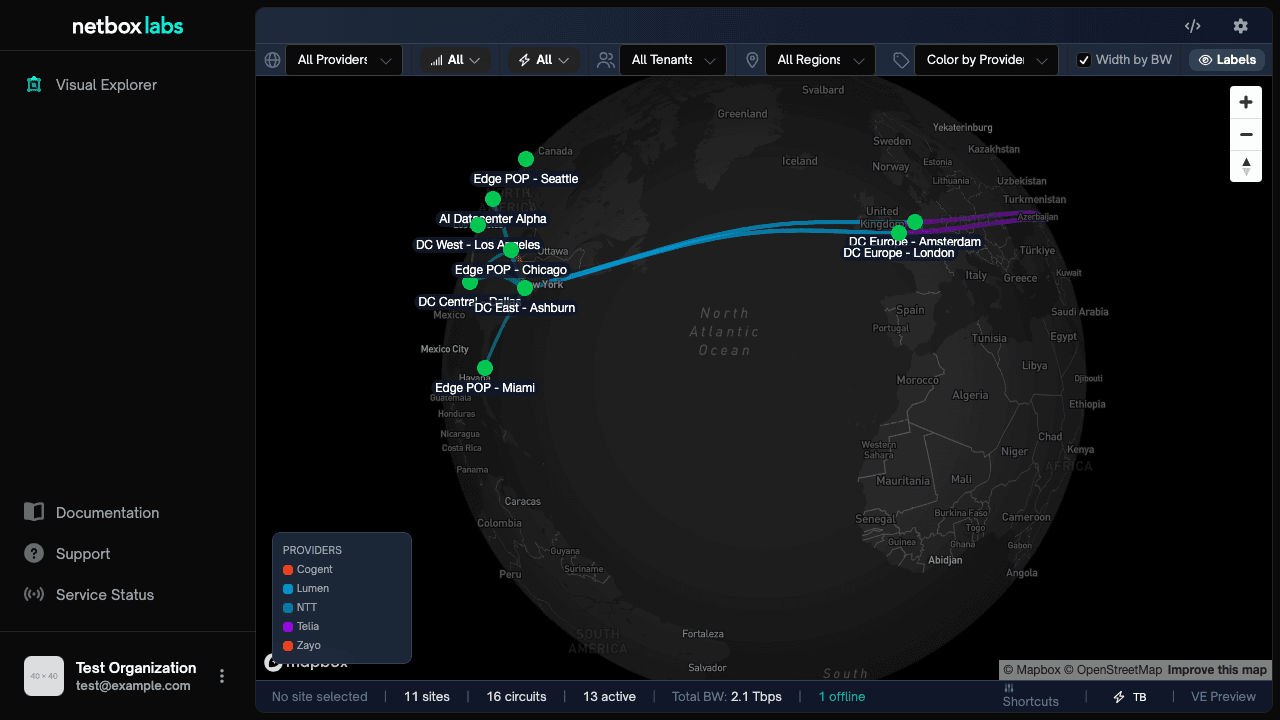
| WAN Map | Where are my sites, and which circuits and providers connect them? Geographic map with circuit paths, bandwidth, and provider filtering. |
| Floorplan | Where is everything physically? Racks placed on a to-scale floorplan, in 2D or 3D, optionally over an architectural drawing. See Floorplans for setup. |
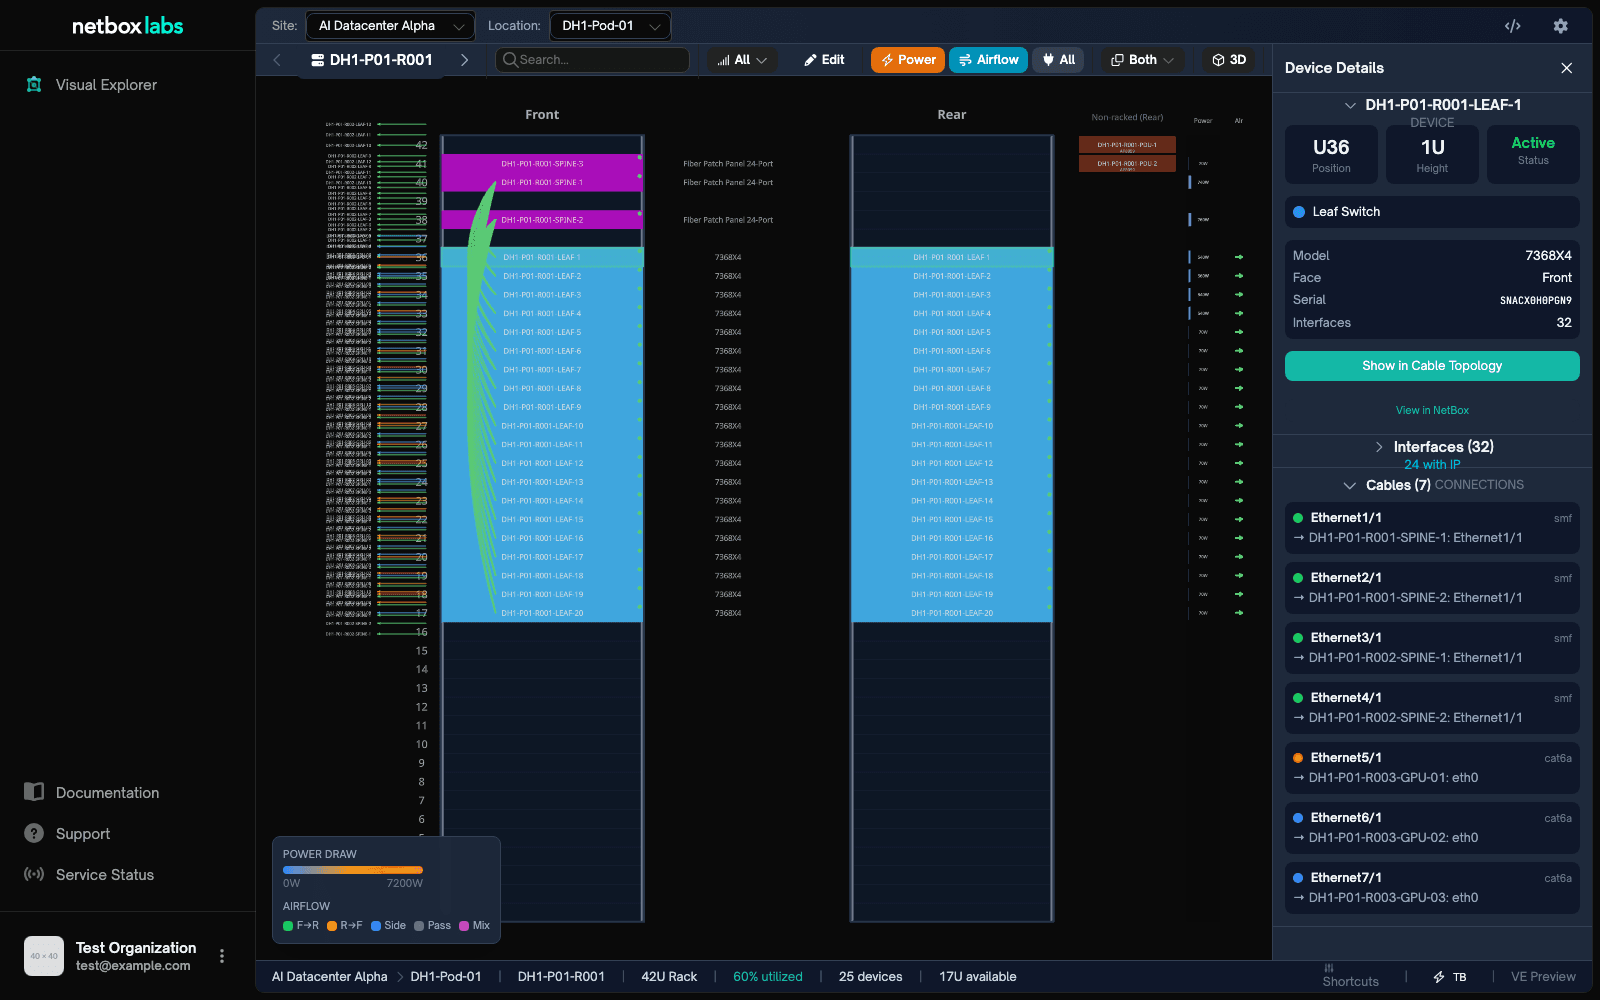
| Rack Elevations | What is in each rack? Front/rear elevations rendered from your rack and device data. |
| Power Chain | How does power reach my equipment? Panel → feed → PDU → outlet → device, with utilization and redundancy checks. |
| Cable Topology | What is physically connected to what? Cable-level connectivity with end-to-end trace. |
| L2/L3 Dependency | How do VLANs, interfaces, and IP addressing relate across devices? |
| BGP Topology | Which ASNs and sessions make up my routing topology? |
| IPAM Map | How is my address space organized? Radial layout of aggregates and prefixes. |
| Prefix Heatmap | Which prefixes are full? Utilization heatmap across your prefix hierarchy. |
Data access
Visual Explorer reads NetBox with your own account's access. You see what you are permitted to see: the views cover objects in NetBox's DCIM, IPAM, and Circuits domains (sites, racks, devices, cables, power infrastructure, prefixes, IP addresses, circuits, and related objects), and anything your NetBox permissions exclude simply doesn't appear.
Two things are worth knowing up front:
- Read-mostly. Visual Explorer only writes to NetBox in one place - the floorplan editor, where you place racks and calibrate background images. Everything else is read-only.
- Fast bulk reads. Visual Explorer uses NetBox Labs' TurboBulk data path to load large datasets - tens of thousands of devices, interfaces, and IP addresses - in seconds rather than minutes. This happens automatically; there is nothing to configure.
Good data makes good visualizations
Visual Explorer draws exactly what your NetBox contains - no more, no less. This is a feature: the views are an honest mirror of your system of record, and gaps in a visualization are gaps in your documentation, made visible.
A few examples of how modeling depth shows up on screen:
- The Power Chain view is only as complete as your power modeling. If panels, feeds, and the cables from feeds to PDUs (and PDU outlets to device power ports) are documented, you get a full chain with utilization and redundancy analysis. If the cabling is missing, the chain stops where the documentation stops.
- The WAN Map places sites by the latitude/longitude on your NetBox site records and draws circuits from your Circuits data. Sites without coordinates and undocumented circuits simply don't appear.
- Cable Topology and L2/L3 Dependency reflect your cable and interface documentation. A device that appears isolated on screen usually has undocumented cabling, not a rendering problem.
- Floorplan shows the racks you have placed. Racks that exist in NetBox but haven't been positioned yet wait in an "unplaced" panel until someone drags them into place.
Teams often use Visual Explorer as a data-quality tool in its own right: the fastest way to find undocumented cabling or unplaced racks is to look at the picture.
Using the views
Scoping. Start by picking a site. Views that support it let you narrow further to a location or a single rack. The status bar at the bottom summarizes what's in scope - object counts, total power, utilization - so you can sanity-check that you're looking at what you think you are.
Details panel. Selecting any object opens the panel on the right. It shows the object's key attributes and its immediate relationships - for a PDU, the upstream feed and per-outlet usage; for a prefix, its utilization and children. View in NetBox takes you to the object's NetBox page when you need to edit.
Filters and display options. Each view has a toolbar tuned to its subject - provider and status filters on the WAN Map, aggregation levels and redundancy highlighting on the Power Chain, utilization overlays where they make sense. Filters are encoded in the URL along with everything else.
Export and embedding. Views offer image export from the toolbar for use in documents and reviews. For a live picture instead of a static one, use Embed this view to generate an iframe snippet you can paste into a wiki page, runbook, or dashboard - the embedded view renders chromelessly and stays current with your NetBox data, and you choose how interactive it should be (from a static rendering up to full pan/zoom and selection).
What to expect
- Freshness. Views read current NetBox data when they load. Refresh the page after making NetBox edits to see them reflected.
- Scale. Large sites render smoothly; views aggregate automatically where detail would become noise (for example, the Power Chain collapses to PDU or rack summaries as outlet counts grow, and you can switch aggregation levels manually).
- Empty or sparse views almost always mean the underlying domain isn't modeled in NetBox yet - not that something is broken. See the examples above for what each view needs.
Troubleshooting
A view is empty for my site. Check that the objects the view depends on exist in NetBox for that site - racks and devices for elevations, power panels and feeds for the power chain, prefixes for the IPAM views, site coordinates and circuits for the WAN Map.
Devices or connections are missing from a topology. The cables or interfaces involved aren't documented in NetBox. Add them in NetBox and reload.
A rack doesn't appear on the floorplan. It hasn't been placed yet - open the floorplan in edit mode and drag it from the unplaced racks panel. See Floorplans.
The power chain stops at the PDU / shows nothing downstream. Document the cable from the power feed to the PDU's input, and from PDU outlets to device power ports. The chain follows documented cabling.
Something I can see in NetBox doesn't appear. Confirm your account has read access to that object type, and that the view's filters (status, provider, type) aren't excluding it.
Numbers look stale. Reload the view - data is fetched at load time. If a discrepancy persists after a reload, compare against the object in NetBox and let NetBox Labs support know what you found.
FAQ
Does Visual Explorer change my NetBox data? Only when you use the floorplan editor to place racks or calibrate images, and those writes are explicit - you drag, you save. Every other view is read-only.
Do I need to configure anything for performance? No. Visual Explorer's bulk data path is enabled and managed by NetBox Labs.
Can I share a specific view with a colleague? Yes - copy the URL. Scope, filters, and display options are encoded in it. For pages outside the console - wikis, runbooks, NOC dashboards - embed the view as an iframe instead, so it stays live.
Why do two views disagree with each other? They can't - both read the same NetBox data. What can differ is scope and filters; check the status bar and toolbar on each.
We use custom fields and plugins heavily. Will those appear? Visual Explorer visualizes NetBox's core DCIM, IPAM, and Circuits models. Custom fields appear where the details panel shows object attributes, but custom models from third-party plugins are not visualized.