Enrichment recipes
Step-by-step patterns for joining NetBox context onto metrics, logs and flows.
How enrichment works. A NetBox query returns a flat table (one row per device/IP/prefix). A join key renames one NetBox field into a column that exactly matches a label on your metrics or logs (same name, same value), optionally transforming it on the way (lowercase, strip domain, drop CIDR mask, regex). A Grafana transformation, usually Join by field, then lines the two tables up, and every series row carries its NetBox context. Full transform reference: JOIN-KEYS.md.
Want a sandbox with everything pre-wired? See the Demo:
./demo/run.shbrings up a real NetBox plus Prometheus, Loki and synthetic telemetry, all labeled to match.
Recipe 1: Enrich Prometheus/SNMP metrics with site, role and tenant
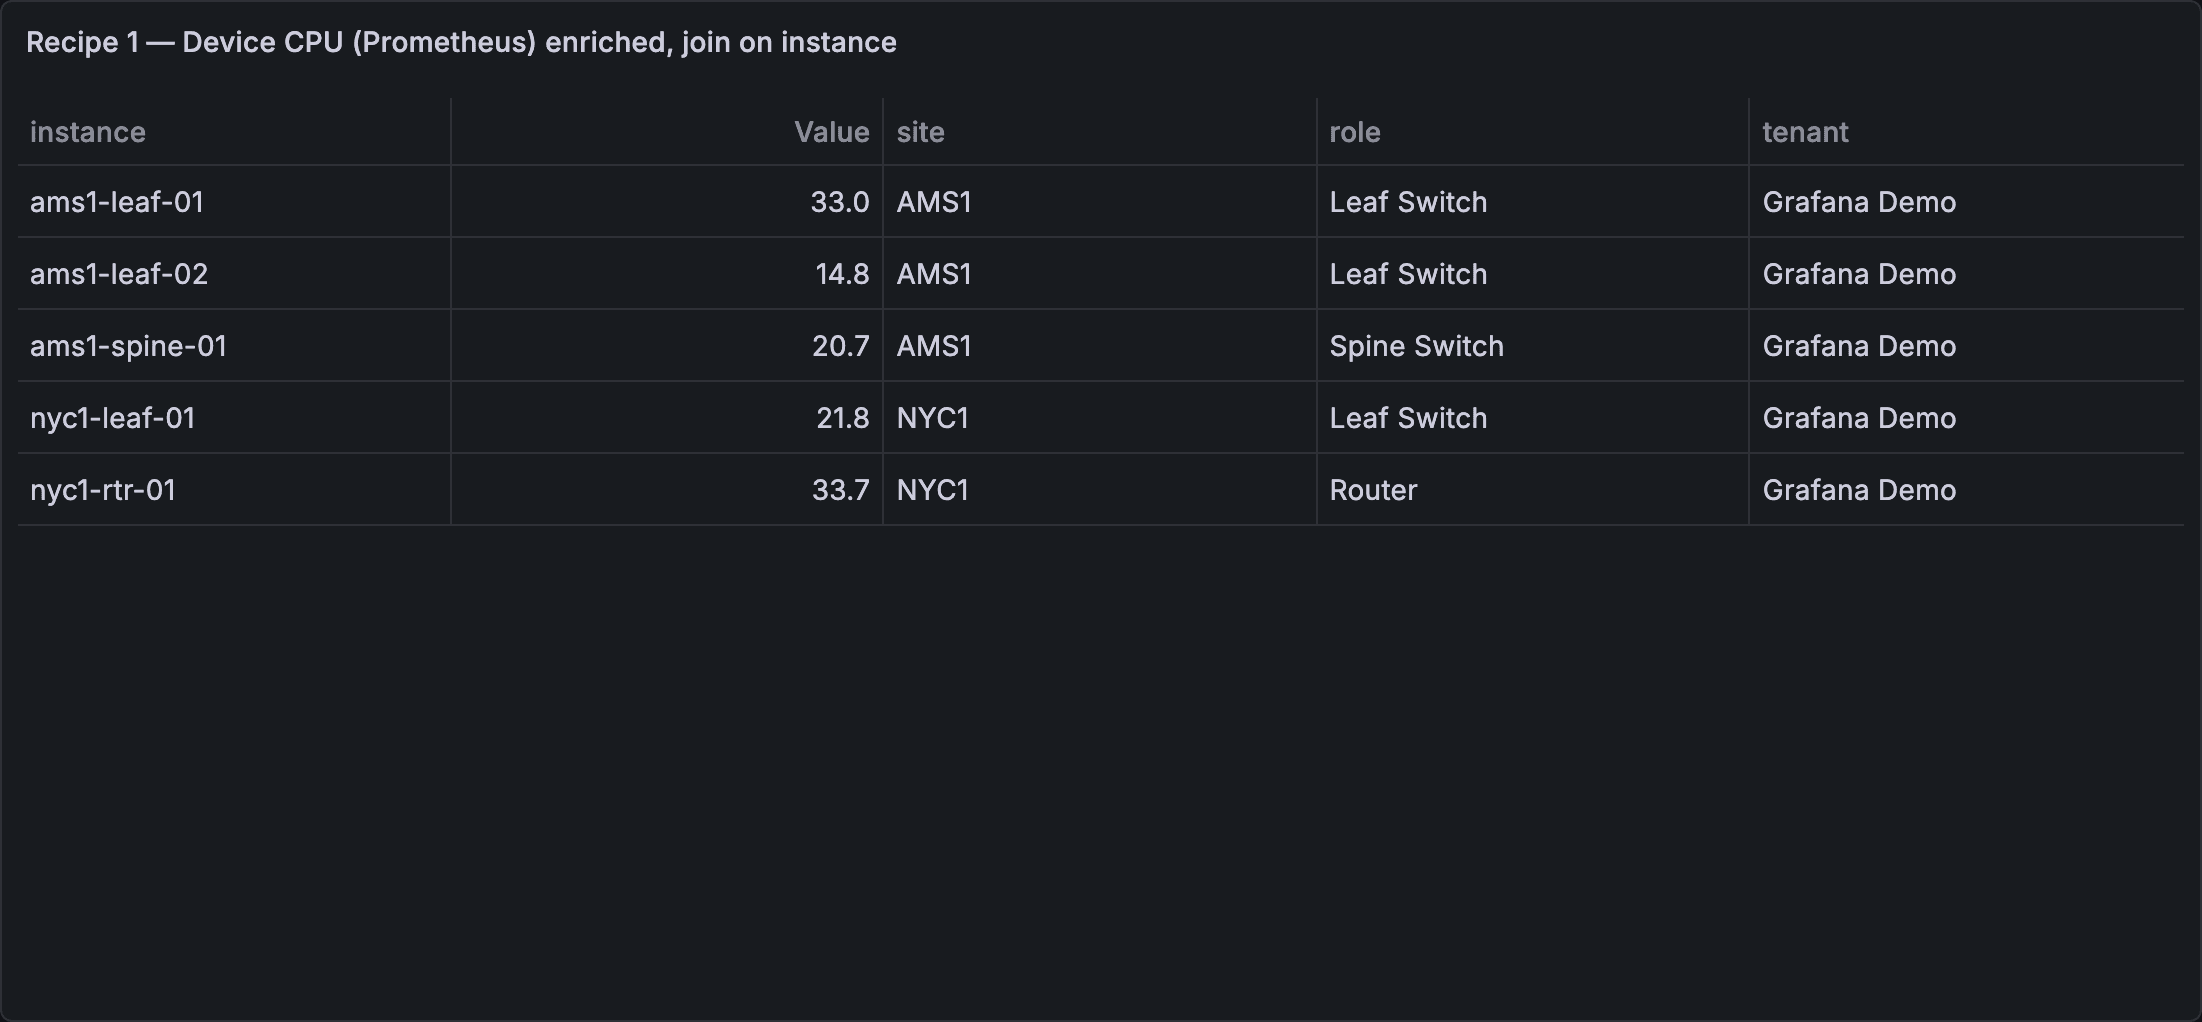
You need: a Prometheus (or any SQL/TSDB) datasource whose series carry a device
identifier label (here: instance), and this plugin connected to your NetBox.
Steps:
- Create a table panel. Query A (Prometheus): your metric, e.g.
device_cpu_percent, with Format = Table and Instant enabled. - Add query B with the NetBox datasource: query type Objects, object type
Devices (
dcim/devices). In Return fields pickname,site,role,tenant, and set Limit to cover your fleet (e.g. 1000). - Still in query B, add a Join key: source
name→ outputinstance, transform strip domain (leaf1.dc1.corp→leaf1). The output name must equal your metric label exactly. - In Transformations, add Join by field: mode Outer, field
instance. - Add Filter data by values → keep rows where
Valueis not null (drops NetBox devices with no metrics), then Organize fields and hideTime,name, and any leftover label columns (__name__,job, …) so onlyinstance,Value,site,role,tenantremain.
Expected result:
| instance | Value | site | role | tenant |
|---|---|---|---|---|
| dmi01-akron-rtr01 | 38.2 | DM-Akron | Router | Dunder-Mifflin |
| dmi01-albany-sw01 | 21.7 | DM-Albany | Access Switch | Dunder-Mifflin |
If it doesn't match: your series may use a different label (device, node): set
the join key output to that name instead. Case mismatches (LEAF1 vs leaf1) →
transform lowercase. All transforms:
JOIN-KEYS.md.
Recipe 2: Enrich Loki logs with device context
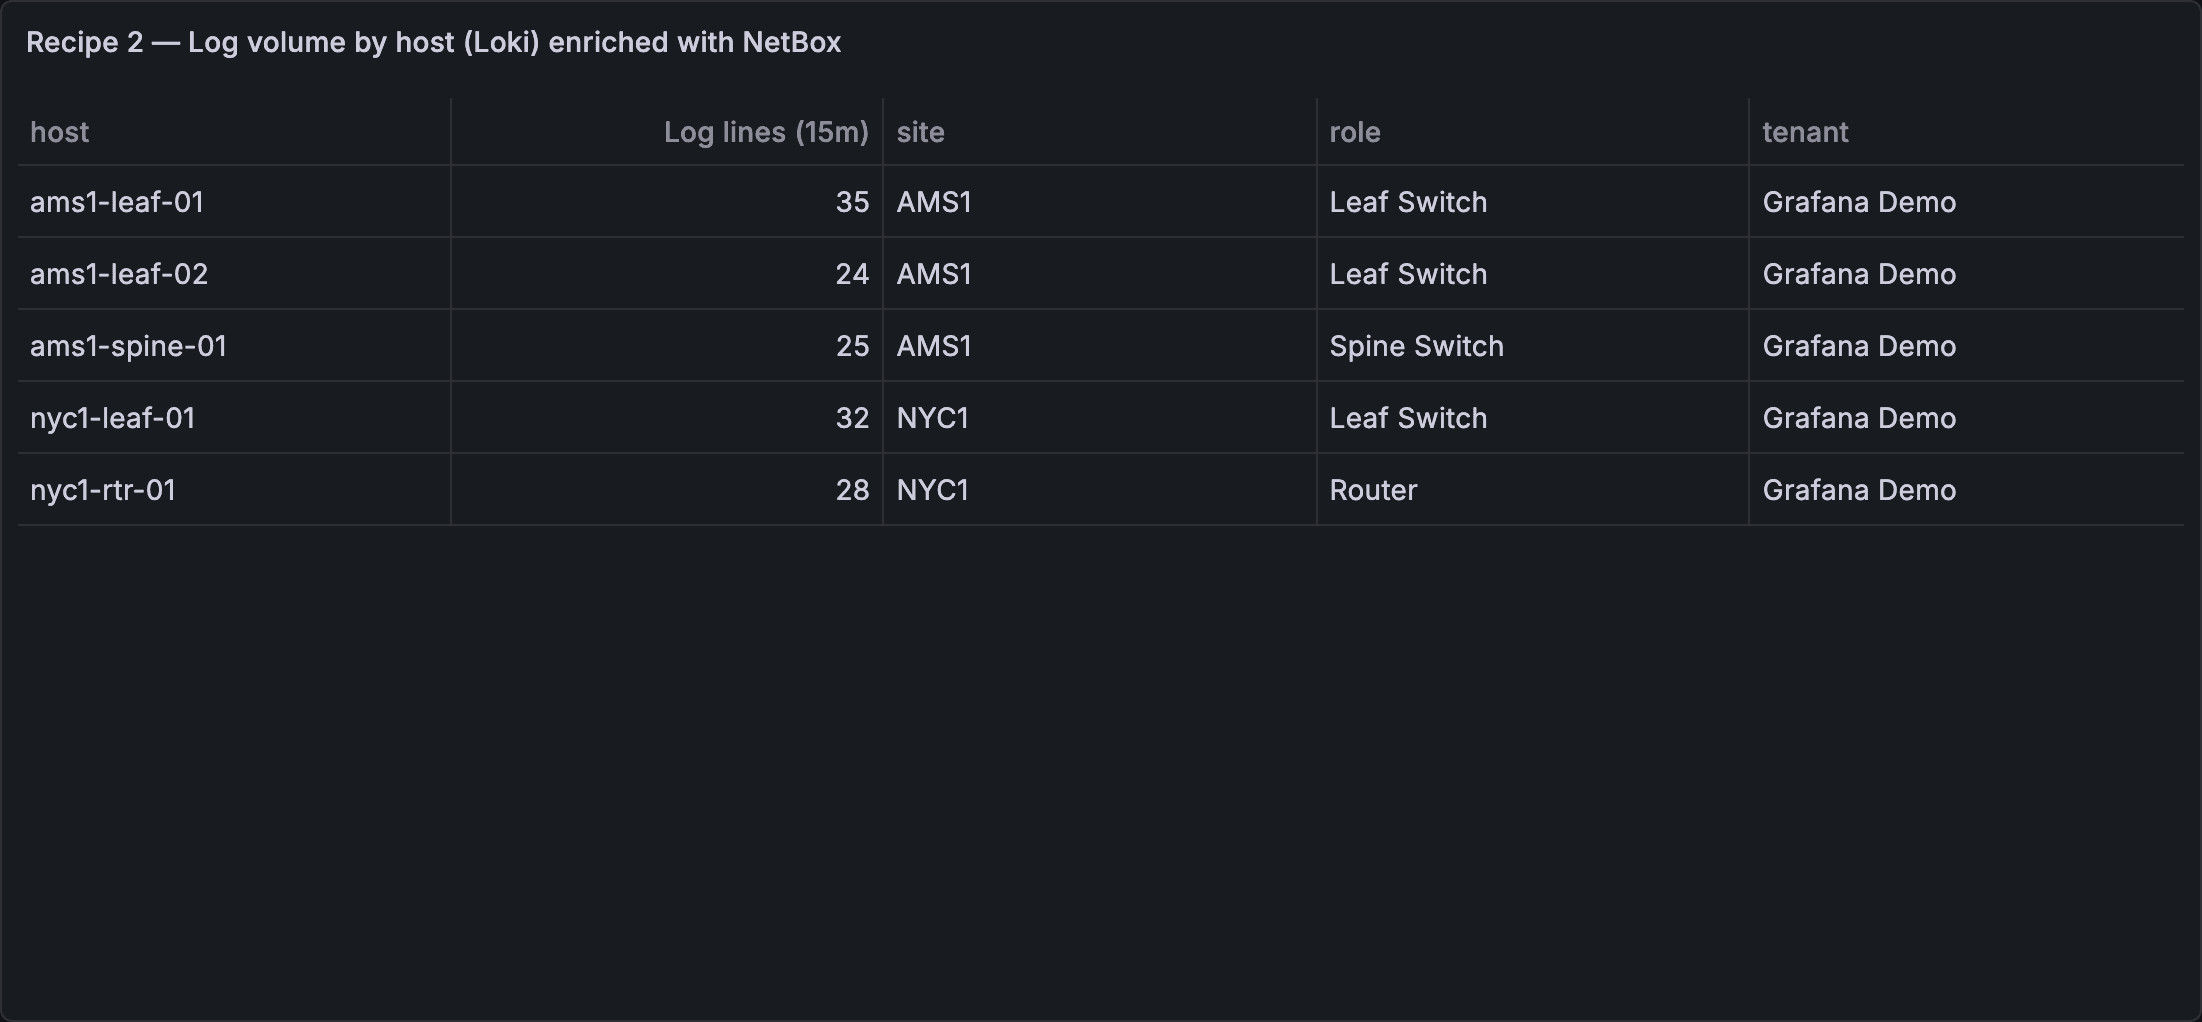
You need: a Loki datasource whose streams carry a hostname label (here: host).
Steps:
- Create a table panel. Query A (Loki): a metric query over your logs, e.g.
sum by (host) (count_over_time({job="syslog"}[15m])), query type Instant. - Add query B (NetBox): Objects → Devices (
dcim/devices); Return fieldsname,site,role,tenant; Limit e.g. 1000; Join keyname→host, transform strip domain. - Transformations: add Labels to fields, then Merge series/tables (Loki
returns one frame per host, and merge correlates them with the NetBox rows on the
shared
hostcolumn; don't use Join by field here), then Filter data by values → keep where the log-count column is not null, then Organize fields: hideTimeandname, and rename the log-count column toLog lines (15m). Grafana names that columnValue #A(after the Loki query's refId), so pick whatever it shows in the field dropdown: it will not be plainValuethe way a single Prometheus query is.
Expected result:
| Log lines (15m) | host | site | role | tenant |
|---|---|---|---|---|
| 42 | dmi01-akron-rtr01 | DM-Akron | Router | Dunder-Mifflin |
(Column order follows the merge; drag fields in Organize fields to taste.)
Now group noisy hosts by site or filter the log volume table to one tenant.
If it doesn't match: label named hostname/instance → change the join key output;
logs carry FQDNs but NetBox has short names → keep strip domain; the reverse →
apply a regex transform instead
(JOIN-KEYS.md).
Recipe 3: Enrich flows or logs by IP
Two variants: exact (the observed IP exists in NetBox IPAM) and longest-prefix (any IP, resolved to its containing prefix's context). Start with exact; switch when you see empty joins.
You need: any datasource whose rows carry bare IP labels/fields (flow collector, firewall or DNS logs, …) and this plugin connected to your NetBox.
3a: exact IP join
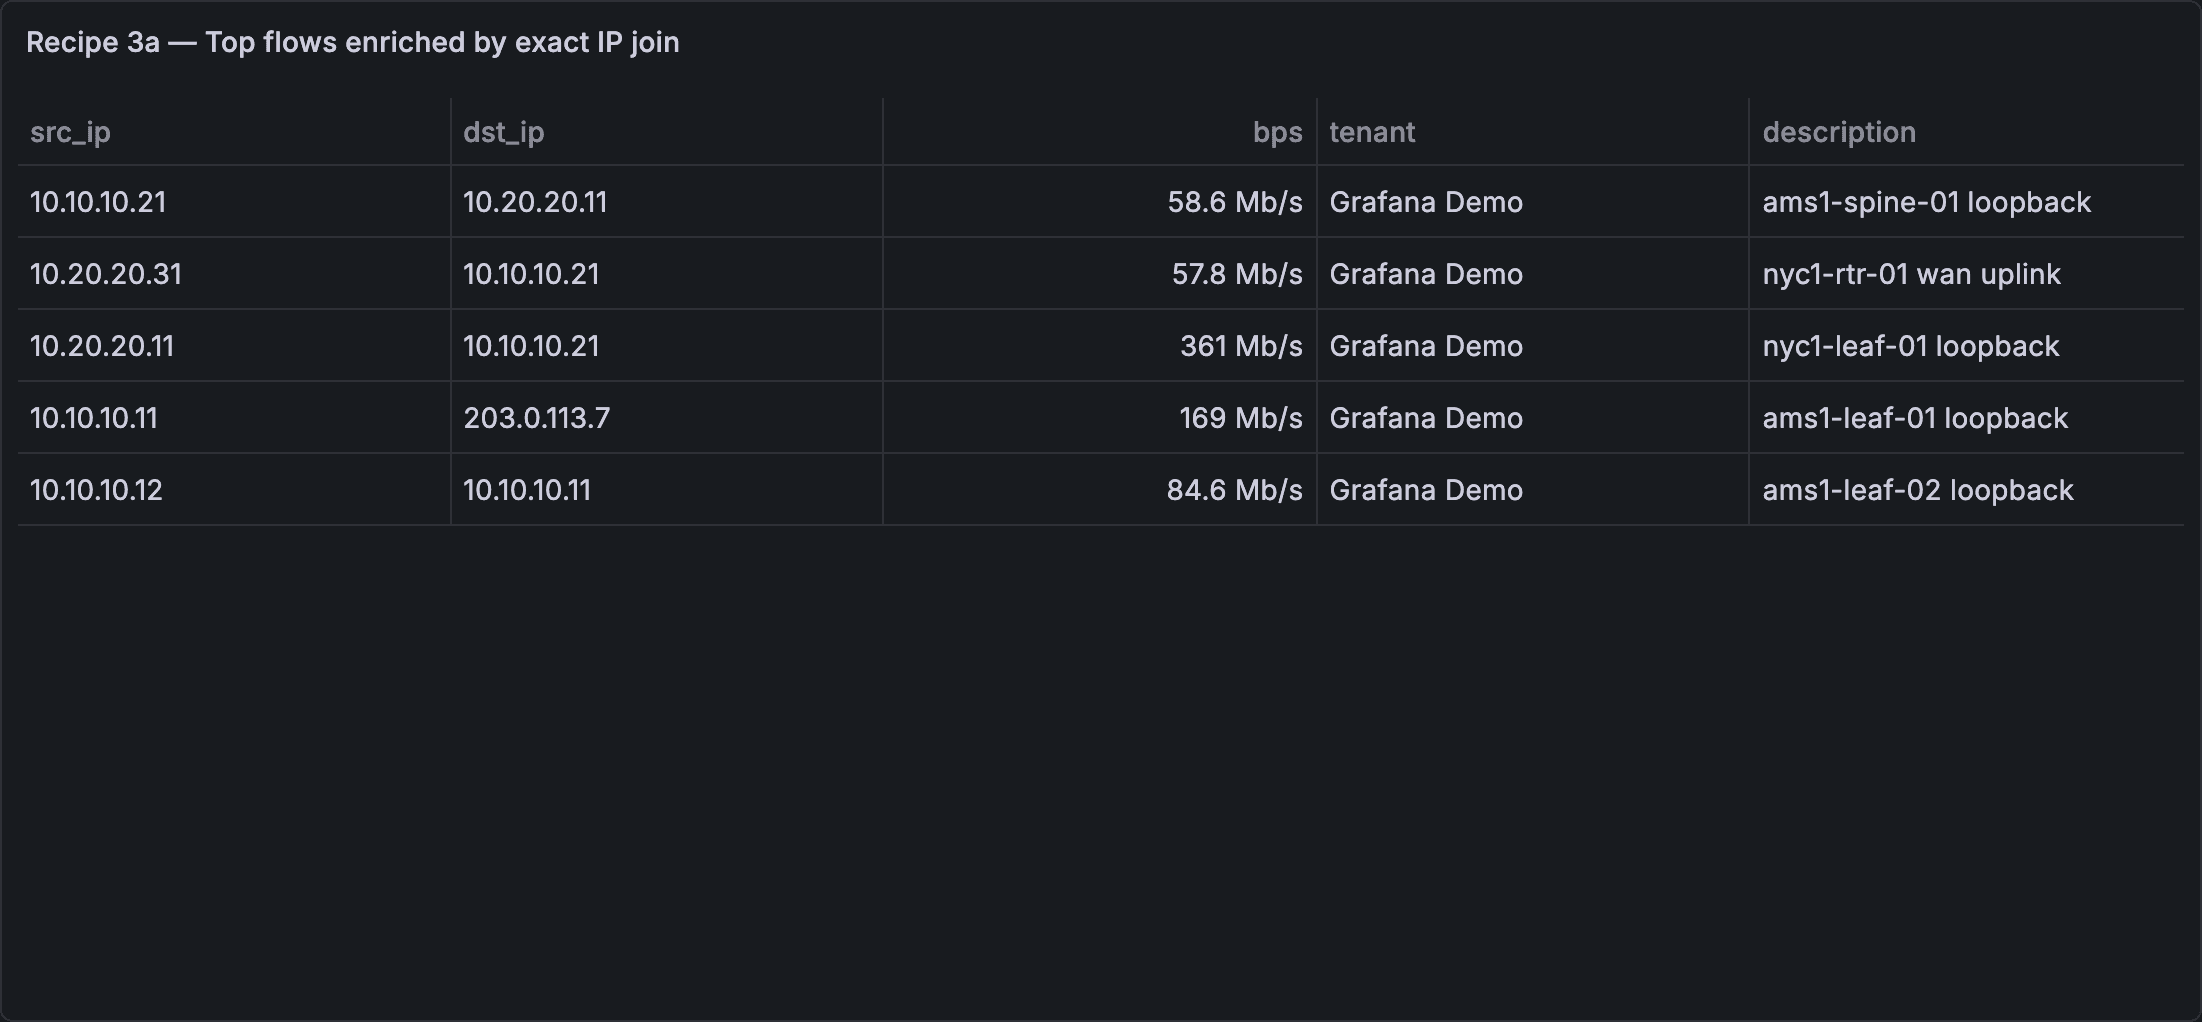
- Query A (your flow datasource): a table of flows keyed by IP, e.g. Prometheus
topk(15, rate(flow_bytes_total[5m]) * 8)with labelssrc_ip,dst_ip, with Format = Table and Instant enabled. - Query B (NetBox): Objects → Ip Addresses (
ipam/ip-addresses); Return fieldsaddress,tenant,description; Limit e.g. 1000; Join keyaddress→src_ip, transform IP host (drops the/24mask so10.112.128.1/24matches the label10.112.128.1). - Transformations: Join by field (Outer) on
src_ip, then Filter data by values →Valueis not null, then Organize fields: hideTime,address,ip,job,instance, renameValue→bps.
Expected result:
| src_ip | dst_ip | bps | tenant | description |
|---|---|---|---|---|
| 10.112.128.1 | 10.113.1.7 | 48,200,113 | Dunder-Mifflin | rtr01 uplink |
| 10.112.129.10 | 203.0.113.7 | 9,881,220 | Dunder-Mifflin |
3b: IP enrichment (works for any IP)
Exact joins fail for IPs that aren't individually registered in IPAM. The IP enrichment query type resolves each IP to whatever NetBox does know about it - the address record, its interface and owning device, or failing that the longest containing prefix:
-
Create a dashboard variable
flow_ips(type Query, your flow datasource), e.g. Prometheuslabel_values(flow_bytes_total, dst_ip). Enable Multi-value + Include All. -
Add a NetBox query: query type IP enrichment; in IPs enter
${flow_ips:csv}; pick context fields. Which columns come back populated for a given IP depends on what NetBox actually knows about that address - per row, it's always exactly one of three outcomes, never a mix:- The IP is a registered address assigned to a device interface (e.g. a loopback
or a routed interface):
address_*(address_dns_name, …),interface_name,is_primary_ipanddevice_*(device_name,device_site, …) populate.prefix_*stays blank - the device hop already answered the question a prefix lookup would. - The IP is a registered address not assigned to any interface, or assigned to a VM
interface (VMs have no NetBox device):
address_*populates (plusinterface_nameandvm_namefor the VM case), butdevice_*stays blank - there's no device to attach - andprefix_*still stays blank; a matched address record never falls through to the prefix lookup. The virtual machine itself is named, invm_name, which is in the default field selection for exactly that reason: without it a VM-assigned row would have no owner column at all. It is a column of its own rather than a value folded intodevice_nameon purpose - NetBox lets a device and a virtual machine share a name, so folding the two together would make thedevice_name→ metricdevicejoin in step 4 match the wrong host.vm_nameanddevice_nameare mutually exclusive per row. There is no othervm_*column: a VM's cluster, site, role, platform and status each cost a second NetBox request, whereas the name is already inside the address record and so is free.is_primary_ipis the one VM fact worth that second request, and it is not avm_*column because it is not a VM-only fact: NetBox gives a virtual machineprimary_ip4/primary_ip6exactly as it gives a device them, so the flag answers on a VM row as readily as on a device row. NetBox also lets an address be assigned to something that is not an interface at all - an FHRP/VRRP group, say - andinterface_*stays blank for those: there is no interface to name.address_*still populates, because the address record itself is real. That leaves an FHRP-assigned address and a wholly unassigned one looking identical (interface_*anddevice_*both blank on either) - addaddress_assigned_object_typeto tell them apart: it carries NetBox's raw relation string (dcim.interface,virtualization.vminterface,ipam.fhrpgroup), blank meaning unassigned. Read that blank only against a row that matched an address record - a row in the third outcome below matched none, so everyaddress_*column is blank there too, this one included.address_statusis the discriminator: populated ⇒ a record matched ⇒ blank really does mean "assigned to nothing". Seeaddress_assigned_object_typebelow for why this is the only signal that finds a VRRP/HSRP virtual address -match_countdoes not. - The IP matches no address record at all: only then does the query fall back to
the longest-containing prefix, populating
prefix_cidr,prefix_scope,prefix_tenant,prefix_role,prefix_vlan.address_*/interface_*/device_*stay blank. There is noprefix_site: NetBox 4.2 replaced a prefix'ssitewith a generic scope (a site, a region or a location), surfaced here asprefix_scope- it carries the site name for a site-scoped prefix. That replacement is also why 4.2 is the supported floor; see Requirements.
Selecting fields is also a performance choice. Each group of columns costs the lookup that fills it, and a group you don't select is not looked up. That matters most for
prefix_*: NetBox's?contains=takes one address at a time, so the fallback is one request per IP with no address record and cannot be batched - measured at ~20 ms per IP, or ~20 s for a 1,000-IP panel of external addresses. The default field selection contains noprefix_*column and therefore makes no prefix request at all; add one only when you want prefix context.device_*costs one extra batched request for the whole IP list.is_primary_ipcosts up to two: the same device request (shared if you selecteddevice_*anyway) plus a batched virtual-machine request, because a VM's primary address - unlike its name - is not carried inside the address record. Both are gated on the column: a query that doesn't select it asks NetBox about no virtual machine at all. - The IP is a registered address assigned to a device interface (e.g. a loopback
or a routed interface):
-
The result is a table keyed by
ip. Use it standalone, or Join by field onipagainst your flow table (rename the flow label toipwith an organize fields transform, or set a join key output accordingly). -
To carry the flow through to the device's own metrics, add a second target on the same panel (set the panel datasource to -- Mixed --) and join on the device name. The enrichment's
device_nameis NetBox's device name, and that is what device/interface metrics are labelled with:- Add a Prometheus target, e.g.
device_cpu_percent(format Table, Instant). In the bundled demo it carriesdevice="AMS1-leaf-01", and so dodevice_up,interface_oper_upandinterface_in_octets_total. - On the NetBox target, add a Join key: source
device_name, outputdevice(transform none). That renames the column to match the metric's label. - Add a Join by field transform on
device, mode outer.
Verified against the bundled demo: all 10
flow_bytes_totalsrc_ipvalues resolve to adevice_namethat is present in Prometheus'sdevicelabel - a 10/10 join.Your exporter may not label by NetBox's device name. A real SNMP exporter typically labels by
sysName, an FQDN, or the polled management address, and none of those has to equal the NetBox name. Check first withlabel_values(<your metric>, device)(orinstance). If the values differ only in form, bridge them with a join-key transform rather than renaming anything in NetBox: lowercase for case differences, strip domain forleaf01.dc.example.com→leaf01, or regex for anything else - see JOIN-KEYS.md. If your exporter labels by management IP instead, join onip(see the note onis_primary_ipbelow). - Add a Prometheus target, e.g.
Expected result (real ds/query response against the bundled demo NetBox, contrasting
all three outcomes):
| ip | address_dns_name | device_name | vm_name | is_primary_ip | interface_name | prefix_cidr | prefix_scope | prefix_tenant | prefix_role | prefix_vlan |
|---|---|---|---|---|---|---|---|---|---|---|
| 10.20.0.1 | leaf01.example.net | AMS1-leaf-01 | true | Ethernet1 | ||||||
| 10.40.0.5 | demo-vm-01 | true | eth0 | |||||||
| 10.10.10.50 | 10.10.10.0/24 | AMS1 | Grafana Demo | LAN | ams1-lan (110) |
10.20.0.1 is AMS1-leaf-01's primary IP on Ethernet1 - a registered, interface-assigned
address, so address_*/interface_*/device_* populate and prefix_* stays blank;
vm_name is blank because a device is not a virtual machine. 10.40.0.5 is a VM's eth0
— a registered address with no owning NetBox device, so interface_name and vm_name
populate but device_* (and prefix_*) don't. The two name columns are exactly the
contrast: each row is named, and which column names it tells you which model NetBox holds
it in. is_primary_ip is true on both of those rows, which is why it carries no
device_ prefix: 10.40.0.5 is demo-vm-01's primary_ip4 in NetBox in precisely the
sense that 10.20.0.1 is AMS1-leaf-01's. 10.10.10.50 has no address record at all, so
the query falls back to the containing prefix (10.10.10.0/24) and every
address/device/interface column is blank - is_primary_ip included, since a row that
found no owner has nothing to be the primary address of.
An IP matching neither an address record nor a containing prefix comes back with every
context column blank - signal too (unknown/external traffic).
Three signals worth knowing about:
-
is_primary_ip- whether this address is the primary IP of whatever owns it: the one NetBox designates as that host's management address, and therefore the one an SNMP poller configured from NetBox would be pointed at. It tells you which of a host's several addresses this row is, which matters when a host appears more than once in a flow table.It answers for devices and virtual machines alike, and that is why it carries no namespace: NetBox gives
dcim.deviceandvirtualization.virtualmachinethe sameprimary_ip4/primary_ip6pair, so adevice_prefix would be a lie on every VM row.Blank does not mean "not primary."
falsemeans this address is not its owner's primary - which includes the common case of an owner NetBox holds no primary for at all (3 of the 15 devices in the bundled demo are in exactly that state). Blank means the question does not apply to this row, and there are three ways to get one: the IP matched no address record (the prefix-fallback outcome - no owner was ever reached); the address is assigned to nothing; or the address is assigned to an FHRP/VRRP group. That last one is the case worth knowing, because it is blank for a reason the other columns don't share: NetBox has no primary-IP concept for FHRP groups at all. Anipam.fhrpgroupholds addresses -ip_addressesis a list - and never elects one of them as primary; the model has noprimary_*field of any kind (verified against NetBox 4.4.10's schema). So the column is left empty there rather than answeringfalseto a question NetBox never asks. Filter accordingly: to find "registered, and not the management address", the test isis_primary_ip == falseis not truesweeps in every FHRP row and every unresolved IP alongside it.
The whole value space, from one query against the bundled demo NetBox:
ip owner address_assigned_object_type is_primary_ip 10.20.0.1 AMS1-leaf-01 (device) dcim.interface true 10.40.0.5 demo-vm-01 (VM) virtualization.vminterface true 10.40.0.6 demo-vm-01 (VM) virtualization.vminterface false 10.50.0.1 demo-vrrp-42 (FHRP group) ipam.fhrpgroup 10.10.10.50 none - prefix fallback The last two rows are the ones to read carefully: both are blank, and neither blank is a failed lookup.
10.50.0.1resolved perfectly - NetBox simply has no primary IP to report for a VRRP group - while10.10.10.50never found an owner to ask. If a genuine failure had blanked the column, the frame would carry a warning notice saying so; blank on its own is never evidence of one.It is not itself a join key, and the useful join does not go through it. Whether you can join on the IP at all depends on your exporter: only if it labels series with the polled address (
instance="10.20.0.1"or similar) is there anything foripto match. The bundled demo's exporter does not - no metric on any device or interface carries an IP-shaped value ondevice,instance,interfaceorjob- so on this stack the device-name join in step 4 is the one that works. Check your own withlabel_values(<your metric>, instance)before designing around either. -
match_count- how many NetBox address records matched the IP, before the row you see was picked.1is the normal case.> 1means NetBox genuinely holds several address records for that host - an anycast address registered once per device, or a virtual IP recorded separately on each member interface; the plugin picks one match deterministically so the row is stable across queries, but a count above 1 is your cue that "the device" isn't unique for that address.It is not a VRRP/HSRP detector. When a virtual address is modelled the way modern NetBox intends - one address record assigned to an FHRP group, with the redundant interfaces as members of that group - there is only ever one record, so
match_countis1and nothing here distinguishes it. Useaddress_assigned_object_typefor that; see below.The pick, in order: a record assigned to an interface (device or VM) wins, then one assigned to anything else (an FHRP/VRRP group, say), then a non-deprecated status, then the lowest NetBox id. Interface assignment comes first because it is the only kind that can fill
interface_*anddevice_*at all - a VRRP group record can describe the address but can never name a port or a device, so preferring it would hand you a blank row while the answer sat in the other record. Assignment outranks status for the same reason: a deprecated interface record still names the device, andaddress_statusshows you it's deprecated. -
address_assigned_object_type- what the address record is assigned to, as NetBox's own raw relation string:dcim.interface,virtualization.vminterface, oripam.fhrpgroup. Blank means unassigned - but blank is not self-evidence of that, and the difference matters when you build an alert on it. Three different situations all leave it empty: an address record that really is assigned to nothing; an IP that matched no address record at all, which never reaches this column; and an IP whose address lookup partially failed, which degrades and raises a WARNING notice on the frame. Only the first is "NetBox says nothing owns this". Pair it withaddress_status- populated ⇒ a record matched - and heed the frame notices, which for a degraded query say exactly which columns are blank for a reason the data cannot show. This column, notmatch_count, is the signal for a VRRP/HSRP virtual address. The two look like they should overlap and don't: a virtual address is shared across a redundant pair much as an anycast address is shared across several devices, but NetBox models it as a single address record assigned to an FHRP group - the redundant interfaces are members of the group, not separate address records - somatch_countis 1, exactly like an ordinary address. (Verified: an FHRP-assigned address returnsmatch_count = 1.)match_countrises only when NetBox genuinely holds several address records for the same host, which is the anycast/duplicate case. Meanwhile the FHRP row leavesinterface_*anddevice_*blank — there is no port or device to name a virtual-group address with - so on its own it looks exactly like an address NetBox has no record of.address_assigned_object_typereadingipam.fhrpgroupis the only thing that tells those apart; an alert or dashboard that keys onmatch_count > 1to find virtual addresses will miss every one of them. It's offered rather than defaulted: most rows are blank ordcim.interface, so it earns a column only when the VRRP/HSRP case is actually in play.
If it doesn't match: exact join (3a) returning mostly empty context → your observed
IPs aren't individually registered in IPAM; switch to 3b. Longest-prefix rows all empty →
the containing prefixes aren't in NetBox, or the variable is empty (check its
label_values(...) query returns IPs). Mask/format mismatches → see the transform
reference in
JOIN-KEYS.md.
In an alert rule there is no variable to feed the IPs in. Use the query's NetBox scope source instead - every address under a prefix, VRF or tenant — and join the metric's IP against it in a SQL expression: Alerts on IP-only metrics.
Prefix & IP utilization
Prefixes and IP ranges expose three extra columns: utilization (percent used, 0 to
100), used, and available. The backend computes them to match the figure shown in
NetBox's own UI (network/broadcast excluded for IPv4 non-pool prefixes, container
prefixes measured by child-prefix coverage, mark_utilized ⇒ 100%).
They are opt-in: they appear only when you add them to Return fields, so ordinary IPAM queries pay no extra cost.
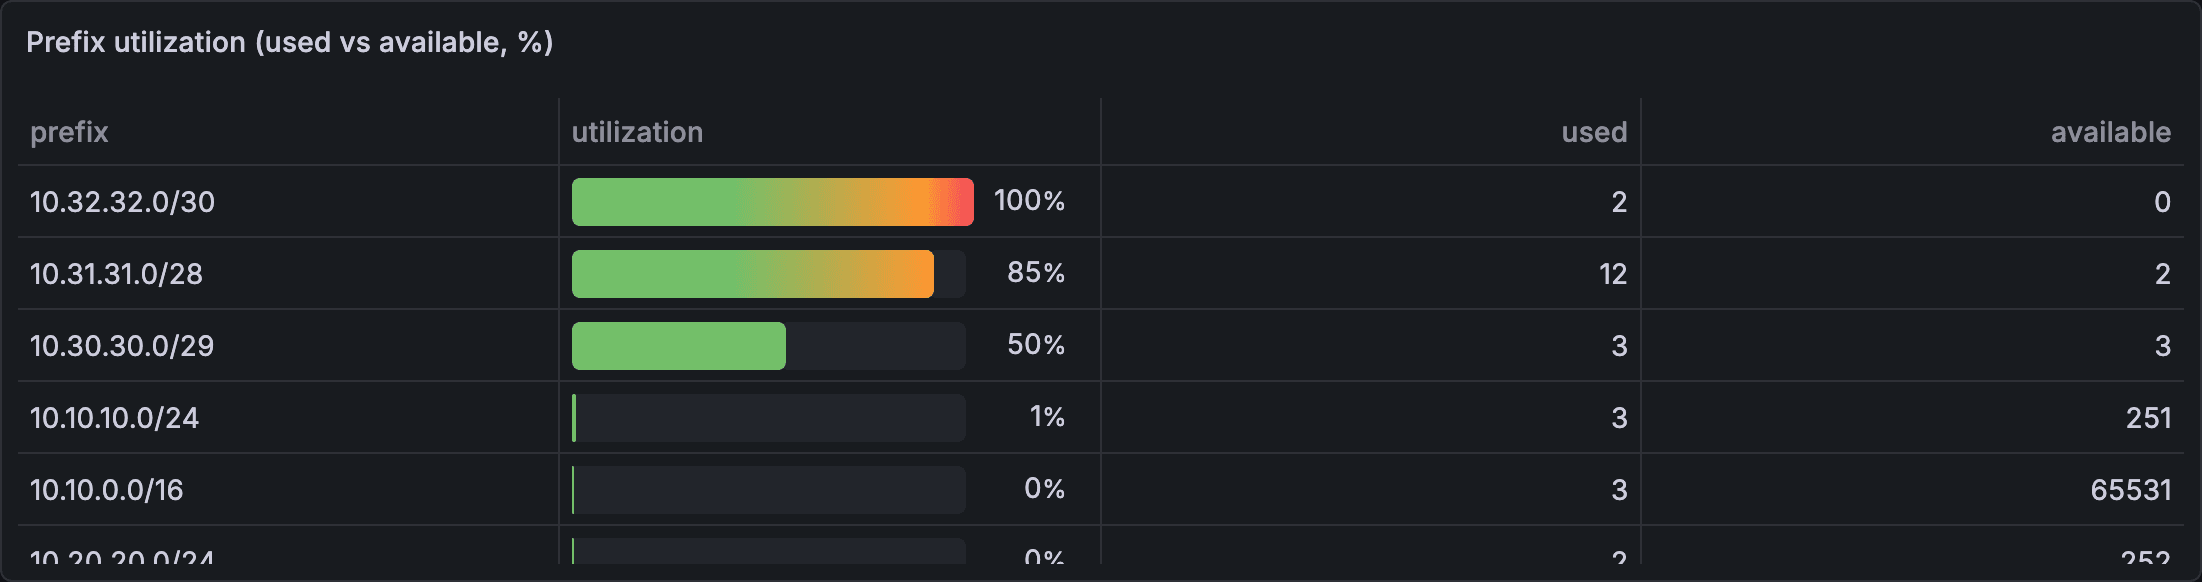
Steps:
- Add a panel with query type Objects, object type Prefixes (
ipam/prefixes) or Ip Addresses → IP ranges (ipam/ip-ranges). Add filters as usual (e.g.site,tenant,role). - In Return fields, pick
prefix(orstart_address) plusutilization,used,available. - Visualize: a Gauge or Bar gauge on
utilizationwith thresholds (e.g. green < 75, red ≥ 90) shows capacity per subnet. A Table with all three columns gives the raw numbers, sorted byutilizationto surface the fullest subnets.
Expected result (Table):
| prefix | utilization | used | available |
|---|---|---|---|
| 10.10.10.0/24 | 1 | 3 | 251 |
| 10.20.20.0/24 | 0 | 2 | 252 |
Notes: utilization is scoped to the object's VRF and mirrors NetBox's own figure. A
leaf prefix's used is the de-duplicated set of its child IP addresses plus any
marked-utilized child ranges, a container prefix is measured by child-prefix coverage,
and an IP range by its child-IP count. It's computed only when a utilization field is
requested (a few extra NetBox calls per row), so ordinary IPAM queries are unaffected.
Joining in a SQL expression
The recipes above join in the browser, with a panel transformation. A Grafana
SQL expression runs the same join on the server instead, which is what you
want when nothing is going to run a transformation: a backend that posts a
dashboard's queries to /api/ds/query, or an alert rule (that case has a page of
its own, NetBox context on metric alerts, which also
covers the sqlExpressions feature toggle and the dialect).
Three queries, with the two inputs hidden so the panel draws only the join:
-
CPU: Prometheus,
Instant, format Table, e.g.device_cpu_percent -
NB: NetBox Objects, Devices, return fields
name, site_slug, role_slug -
J: Expression → SQL:
SELECT NB.site_slug AS site, COUNT(*) AS devices
FROM CPU JOIN NB ON CPU.device = NB.name
GROUP BY NB.site_slug
Join on keys that survive a rename. site_slug against a site label, id
against a netbox_id label. A display name is the one thing in NetBox people
edit freely, and a join on it breaks the day someone tidies a site's name. A
join key renders numbers as plain strings (42, never 42.0), so
id lines up with a Prometheus label as it is.
The NetBox side has to be complete, or the panel fails. An ordinary NetBox
query that matches more objects than its Limit returns what fits and says so
in a notice (Showing 100 of 5,000 matching objects). An expression drops that
notice, so the same result used to reach the panel as a confident wrong number: a
join at limit 5 over 15 devices reported AMS1: 5, with nothing to say ten were
missing. A NetBox query that feeds an expression now fails instead:
Query feeding an expression returned 5 of 15 matching objects, so it would
compute on an incomplete result. Raise the row limit (max 10,000) or add
filters so every match fits.- With the inputs hidden, the panel shows only the expression's own error
(
could not run sql expression [J] because it selects from the results of query [NB] which has an error). Unhide NB, or open the query inspector, to read the message above. - The same applies when part of the result could not be measured or a lookup failed: anything a plain query would have stated in a notice.
- Grafana marks these queries with the
X-Grafana-From-Expr: truerequest header, and the browser sends it for the whole panel as soon as it contains any expression. So a NetBox table drawn directly in such a panel is held to the same standard even if no expression reads it, and a panel with more matches than its Limit fails where it used to show a page with a notice: raise the Limit, or move the table to a panel of its own. A backend calling/api/ds/queryitself should send the header too; without it the NetBox query is treated as an ordinary dashboard query and a truncated result goes through. - The ceiling is 10,000 rows, so an inventory larger than that cannot be joined
whole. Filter the NetBox query down to what the panel is about, and aggregate in
PromQL before the join where you can: Grafana's own
sql_expression_cell_limit(100,000 input cells) is usually reached first.
Beyond joins
- Dashboard variables: variable type Query → NetBox datasource → object type
(e.g. Sites), value field
slug, text fieldname. Chain them (devicesfiltered bysite=$site) and reference as$sitein any panel. A multi-value selection becomes an OR filter, and so does All: every option of the variable, as one repeated NetBox parameter each. On a few hundred sites that is a very long URL and a slow query to say "no filter". When the variable really does list everything, set its Custom all value to$__all: the data source drops a filter row whose value is exactly that token, so All sends no filter at all. It is opt-in because All is not always everything - for a chained variable (sites in $region) or a hand-written list it means every option on offer, and dropping the filter would widen the panel to the whole inventory. A caller with no variables to expand, such as a backend posting to/api/ds/query, sends$__allas the filter value for the same effect. On an IP-enrichment query's IP list the token has nothing to drop - the list is the input - so All resolves nothing, like an empty list. - Change annotations: add a dashboard annotation backed by NetBox; optionally
restrict to content types (
dcim.device,ipam.prefix). Change-log events overlay your panels with who-changed-what. - Deep links: include the
display_urlcolumn (hideable); the primary label column links each row back to its NetBox object page, and links survive joins.