Getting Started
Public Preview
The Cisco Nexus Dashboard integration is currently in public preview and is not yet generally available. Contact support@netboxlabs.com to join the preview.
This guide walks you through setting up the Cisco Nexus Dashboard Integration for NetBox.
- Prerequisites
- Host Requirements
- Nexus Dashboard Requirements
- NetBox Setup
- Agent Setup and Configuration
- Expected Output
- View and Apply Discovered Data in NetBox Assurance
- View the Nexus Dashboard Data in NetBox
- Additional Resources
Prerequisites
Before you begin, ensure you have the following:
- NetBox Cloud or NetBox Enterprise with NetBox Assurance
- Orb Agent Pro credentials (required to download the integration agent image)
- Cisco Nexus Dashboard 4.x reachable from your agent host, with either a username and password or an API key that can read fabric inventory through the Manage API
- Host system with Docker support
- Network connectivity between your host and both your NetBox instance and Nexus Dashboard
Host Requirements
System
- Operating System: Linux, macOS, or Windows with Docker support
- Memory: Minimum 2 GB RAM (4 GB recommended)
- Storage: 1 GB free disk space
- Docker: Version 20.10 or later
Network
- Outbound gRPC/gRPCS access to Diode on your NetBox instance (typically port 443 for gRPCS)
- Outbound HTTPS access to your Nexus Dashboard cluster (typically port 443)
- DNS resolution for both your NetBox instance and the Nexus Dashboard hostname
- Firewall rules configured to allow the above connections from your agent host
Nexus Dashboard Requirements
The integration reads the Nexus Dashboard 4.x unified Manage API (/api/v1/manage/). Apart from the login request, every call it makes is a GET, so an identity with read access to fabric inventory is sufficient. It never writes to Nexus Dashboard or to the fabric.
The endpoints it calls are:
| Data | Endpoint |
|---|---|
| Fabrics | GET /api/v1/manage/fabrics |
| Switches | GET /api/v1/manage/fabrics/{fabric}/switches |
| Interfaces | GET /api/v1/manage/fabrics/{fabric}/switches/{serial}/interfaces |
| VRFs | GET /api/v1/manage/fabrics/{fabric}/vrfs |
| Overlay networks | GET /api/v1/manage/fabrics/{fabric}/networks |
Interfaces require Nexus Dashboard 4.2.x
The per-switch interface endpoint does not exist on 4.1.x. On that version, interfaces and interface-assigned IP addresses are skipped and everything else still syncs. Each device still receives a primary IP, taken from the switch's fabric management address.
Choose an Authentication Method
Credentials are read from the policy config block. Provide one of the two pairs below - if neither pair is complete, the run logs a configuration error and ingests nothing.
| Method | What to set | Notes |
|---|---|---|
| Username and password (JWT) | ND_USERNAME and ND_PASSWORD | The integration calls POST /api/v1/infra/login and uses the returned token as a Bearer credential. The token has a 20-minute lifetime and is refreshed automatically if a call returns 401 mid-run. Optionally set ND_LOGIN_DOMAIN. |
| API key | ND_API_KEY and ND_API_USERNAME | Sent as the X-Nd-Apikey and X-Nd-Username headers. Both values are required together. The key is checked when the run starts with one request for the fabric list, and a rejected key ends the run with an error. There is no token to refresh. |
When both pairs are supplied, the API key takes precedence.
Keep secrets out of the policy file
Write ${ND_PASSWORD} in the policy rather than the password itself. When the agent loads the policy, a config value that is exactly a ${...} reference is replaced with the matching environment variable from the agent process. The .env file in Step 3 is what supplies those variables.
Two details matter in practice:
- The reference must be the whole value.
${ND_PASSWORD}is substituted;prefix-${ND_PASSWORD}is not. - An unset variable is not caught as a missing credential. If the environment variable does not exist, the literal text
${ND_PASSWORD}is passed through as the credential and the login fails when Nexus Dashboard rejects it. See FAQ & Troubleshooting for that case.
Orb Agent can also resolve secrets from an external secret store, including HashiCorp Vault, configured under a separate orb.secrets_manager section of the agent config. Those references use a different form (${vault://...}) - see the Orb Agent documentation for setup.
Login Domains
ND_LOGIN_DOMAIN selects which Nexus Dashboard login domain authenticates the username and password - for example a remote LDAP, RADIUS, or TACACS domain rather than the local one. The value is the domain name as listed by GET /logindomains on your cluster, and it is case-sensitive.
Omit the key to authenticate against the cluster's configured default login domain. When it is omitted the integration sends the server-side DefaultAuth alias rather than leaving the field out, because Nexus Dashboard 4.2 returns a 500 when the domain field is absent entirely.
ND_LOGIN_DOMAIN only applies to username and password authentication. It has no effect when you use an API key.
TLS Verification
By default the Nexus Dashboard server certificate is validated against the host trust store. For a certificate signed by an internal or private CA, add the CA chain to your agent host's trust store and leave the default in place.
Set SKIP_SSL: true to disable certificate verification entirely. This applies to every request the integration makes, including the login request that carries your password, so it exposes the run to a machine-in-the-middle attack. Use it only on trusted networks and for initial testing. For production, provide a proper CA chain and leave SKIP_SSL unset.
NetBox Setup
Generate Diode Client Credentials
- Log in to your NetBox instance.
- Navigate to Diode → Client Credentials.
- Click + Add a Credential.
- Enter a descriptive name (for example, "Cisco Nexus Dashboard Integration").
- Click Create.
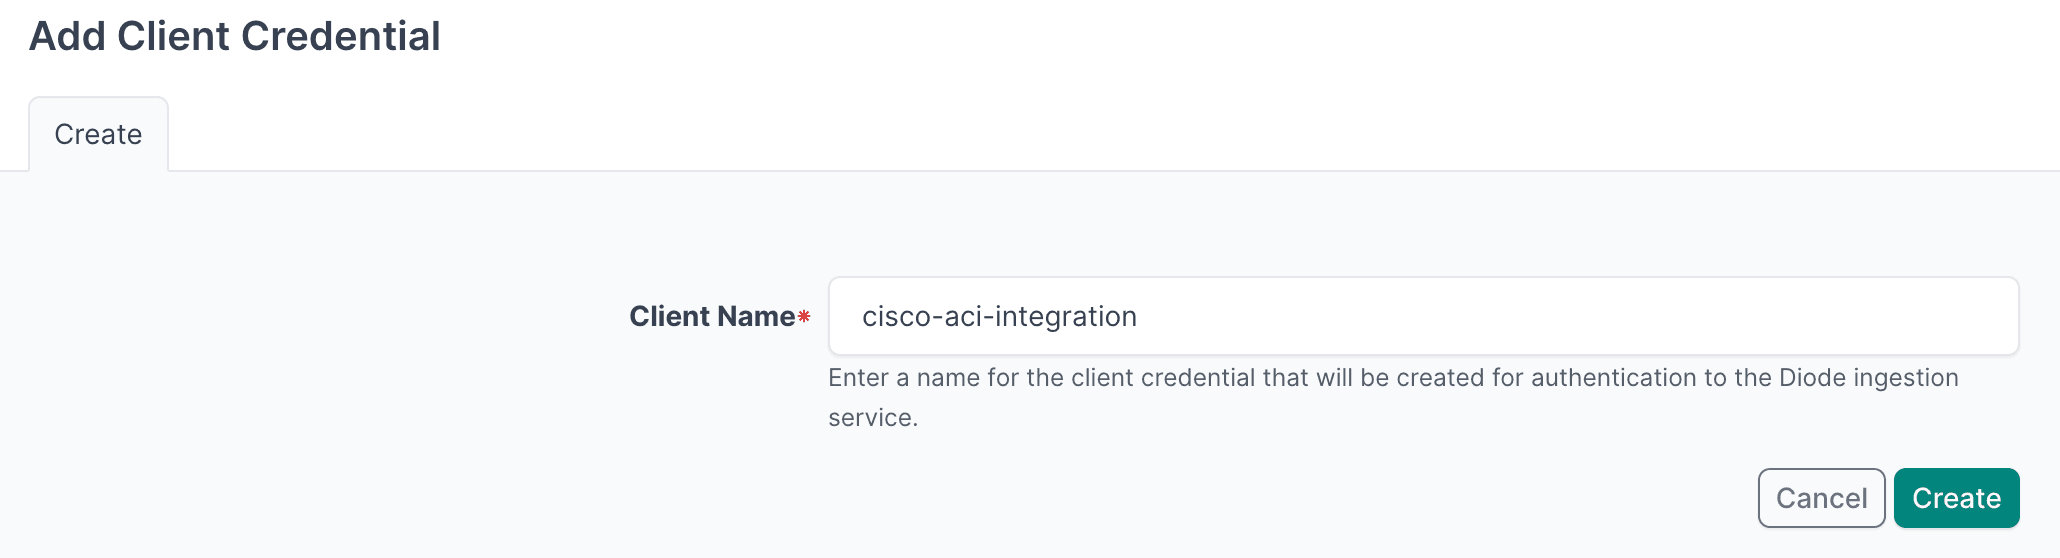
- Important: Copy and securely store the Client ID and Client Secret - you will need them in the agent configuration.
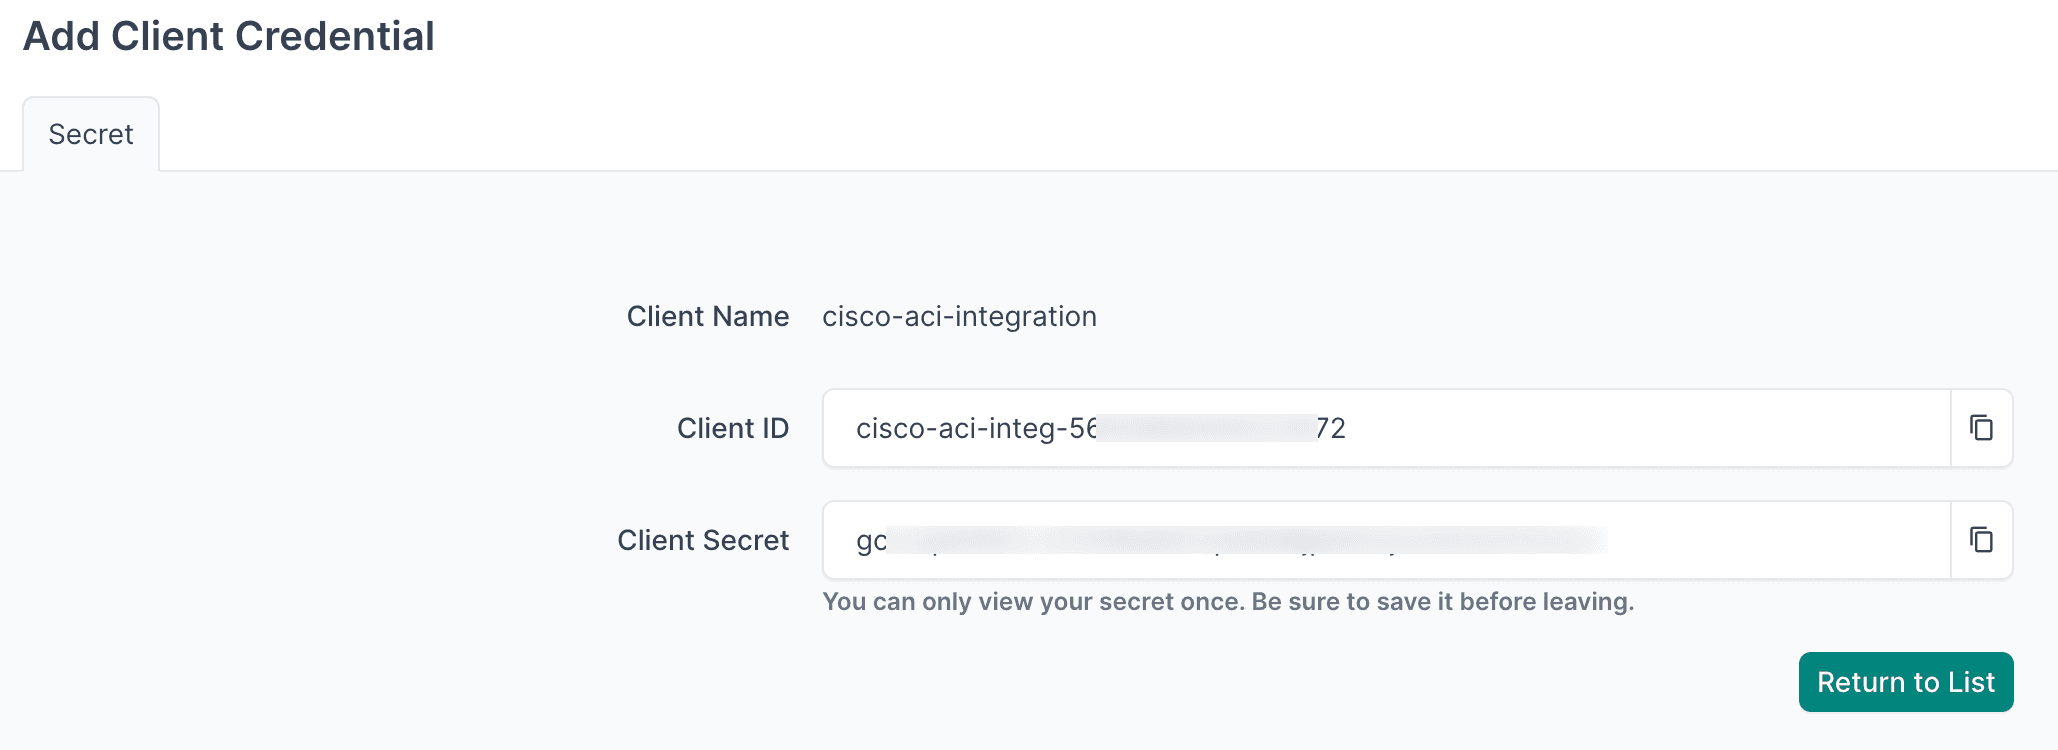
- Navigate to Diode → Settings.
- Copy the Diode target value - you will use this in the agent configuration file.

Agent Setup and Configuration
You can deploy multiple agents, each configured to sync data from a different Nexus Dashboard cluster. Give each a distinct agent_name. Objects are tagged with a per-cluster nd-{host} tag derived from ND_HOST, so each cluster's data stays identifiable in NetBox.
Step 1: Authenticate to the NetBox Labs Image Registry
From your host machine, authenticate to the NetBox Labs registry using the CUSTOMER-IDENTIFIER and token provided by the NetBox Labs team:
docker login quay.io -u netboxlabs+<CUSTOMER-ID> -p <TOKEN>Example session:
% docker login quay.io -u netboxlabs+org-abc123def456 -p <token>
Login Succeeded
Then pull the agent image:
docker pull quay.io/netboxlabs/orb-agent-pro:developStep 2: Configure the Agent
- Create the configuration file (you can name the file anything you like):
touch agent.yaml- Edit the configuration file and add the following. Replace
grpcs://your-instance.netboxcloud.com/diodewith the value from Diode → Settings → Diode target in the NetBox UI:
orb:
  config_manager:
    active: local
  backends:
    worker:
    common:
      diode:
        target: grpcs://your-instance.netboxcloud.com/diode  # Get this value from Diode > Settings > Diode target
        client_id: ${DIODE_CLIENT_ID}
        client_secret: ${DIODE_CLIENT_SECRET}
        agent_name: cisco_nexus_dashboard_01  # Use a meaningful name to identify this agent
  policies:
    worker:
      cisco_nexus_dashboard_worker:
        config:
          package: nbl_cisco_nexus_dashboard
          schedule: "0 */6 * * *"  # Every 6 hours. Set your desired schedule (see examples below)
          ND_HOST: ${ND_HOST}              # Nexus Dashboard host or base URL, e.g. nd.example.com or https://nd.example.com
          ND_USERNAME: ${ND_USERNAME}      # Username/password (JWT) authentication
          ND_PASSWORD: ${ND_PASSWORD}      # Resolved from the agent environment, never written in plain text
          # ND_LOGIN_DOMAIN: "your-login-domain"  # Optional: login domain name, case-sensitive (per GET /logindomains)
          # ND_API_KEY: ${ND_API_KEY}      # Alternative to ND_USERNAME/ND_PASSWORD
          # ND_API_USERNAME: ${ND_API_USERNAME}  # Required with ND_API_KEY
          # SKIP_SSL: false                # Optional: set true to disable TLS verification (testing only)
          BOOTSTRAP: false                 # Set to true for initial setup only
        scope:                             # Optional: leave empty to ingest all fabrics
        # scope:                           # Or restrict ingestion to named fabrics:
        #   fabrics:
        #     - evpn-lab
        #     - dc1-fabric
Authentication methods
Provide either ND_USERNAME and ND_PASSWORD, or ND_API_KEY and ND_API_USERNAME. Each pair must be complete. API key authentication takes precedence when both pairs are supplied.
Schedule Examples
The schedule field uses cron syntax. Common examples:
"*/30 * * * *"- Every 30 minutes"0 * * * *"- Every hour"0 */6 * * *"- Every 6 hours"0 2 * * *"- Daily at 02:00
ND_HOST is a host or base URL
Set ND_HOST to the cluster's host name or base URL - for example nd.example.com or https://nd.example.com. When no scheme is given, https:// is used. A trailing slash is trimmed automatically. The same value, with the scheme removed, forms the per-cluster nd-{host} tag applied to discovered objects.
Scope Configuration
The scope section limits which fabrics are synchronized. Configure it under a scope key in the policy, separate from config.
fabrics- a list of fabric names. Only fabrics whose name matches an entry in the list are ingested, along with all of their switches, interfaces, VRFs, and overlay networks. Use["*"]or omit the key to ingest every fabric on the cluster.
Names are matched exactly against each fabric's name field in Nexus Dashboard, so they are case-sensitive.
Example:
scope:
  fabrics:
    - evpn-lab
    - dc1-fabric
See Scope Parameters for details.
Bootstrap Mode (First-Time Setup)
Bootstrap mode creates the static content in NetBox that the integration requires before the first full sync. Run it once on initial setup, then disable it for all subsequent runs. In bootstrap mode the integration makes no Nexus Dashboard API calls, so credentials are not required.
What bootstrap mode creates:
- Tags:
cisco,nexus-dashboard,discovered - Custom fields:
nd_switch_db_idandnd_segment_id - The
Ciscomanufacturer
Device roles are not created in bootstrap mode. They are created on a real sync, and only for the roles the discovered switches actually use, so bootstrap does not leave unused roles in NetBox.
Configuration:
config:
  BOOTSTRAP: true  # Set to true for initial setup, false for regular operation
First-time run process:
- Set
BOOTSTRAP: truein your configuration. - Run the agent and monitor the output for
executed successfully. - Stop the agent by pressing
Ctrl+Conce you seeexecuted successfully. - Apply the deviations in NetBox Assurance (see Apply Deviations below).
- Set
BOOTSTRAP: falsefor all future runs.
Optional - Dry Run Mode
The agent can run in dry run mode, which writes discovered data to a JSON file instead of sending it to NetBox. This is useful for troubleshooting, for reviewing what the integration will ingest before committing to your NetBox instance, or for sharing data with the NetBox Labs support team.
Add the following to the diode section of your configuration:
      diode:
        dry_run: true
        dry_run_output_dir: /opt/orb/  # Output file is written to this directory
Step 3: Run the Agent
Run the agent to synchronize Nexus Dashboard fabric inventory into NetBox.
Method 1: Set Environment Variables Manually
- Export Diode credentials:
export DIODE_CLIENT_ID="your-client-id"
export DIODE_CLIENT_SECRET="your-client-secret"- Export Nexus Dashboard connection details:
export ND_HOST="https://nd.example.com"
export ND_USERNAME="your-nexus-dashboard-username"
export ND_PASSWORD="your-nexus-dashboard-password"- Run the agent:
docker run \
  -v $PWD:/opt/orb/ \
  -e DIODE_CLIENT_SECRET \
  -e DIODE_CLIENT_ID \
  -e ND_HOST \
  -e ND_USERNAME \
  -e ND_PASSWORD \
  quay.io/netboxlabs/orb-agent-pro:develop \
  run -c /opt/orb/agent.yaml
Method 2: Use a .env File (Recommended)
- Create a
.envfile:
touch .env- Edit the
.envfile and add the following:
## NetBox Diode credentials (from NetBox Setup)
DIODE_CLIENT_ID=your-client-id
DIODE_CLIENT_SECRET=your-client-secret

## Cisco Nexus Dashboard connection
ND_HOST=https://nd.example.com
ND_USERNAME=your-nexus-dashboard-username
ND_PASSWORD=your-nexus-dashboard-password
Important
Replace the placeholder values with your actual credentials:
your-client-idandyour-client-secretfrom the NetBox Diode setuphttps://nd.example.comwith your Nexus Dashboard host or base URLyour-nexus-dashboard-usernameandyour-nexus-dashboard-passwordwith an identity that can read fabric inventory. To use an API key instead, setND_API_KEYandND_API_USERNAMEin place ofND_USERNAMEandND_PASSWORD
- Run the agent:
docker run \
  -v $PWD:/opt/orb/ \
  --env-file .env \
  quay.io/netboxlabs/orb-agent-pro:develop \
  run -c /opt/orb/agent.yaml
Security Best Practice
Add .env to your .gitignore file to avoid committing credentials to version control:
echo ".env" >> .gitignoreExpected Output
After starting the agent, depending on the schedule you defined, you will see log output as the integration reads Nexus Dashboard and sends data to NetBox:
{"time":"2026-09-10T06:00:01.123456789Z","level":"INFO","msg":"worker stderr","log":"INFO:nbl_cisco_nexus_dashboard.nexus_dashboard_diode:Processing Nexus Dashboard at https://nd.example.com"}
{"time":"2026-09-10T06:00:01.234567890Z","level":"INFO","msg":"worker stderr","log":"INFO:nbl_cisco_nexus_dashboard.client:Authenticated with Nexus Dashboard at https://nd.example.com via username/password"}
{"time":"2026-09-10T06:00:01.345678901Z","level":"INFO","msg":"worker stderr","log":"INFO:nbl_cisco_nexus_dashboard.nexus_dashboard_diode:Fetched 1 fabrics"}
{"time":"2026-09-10T06:00:01.456789012Z","level":"INFO","msg":"worker stderr","log":"INFO:nbl_cisco_nexus_dashboard.builders.sites:Created site: evpn-lab"}
{"time":"2026-09-10T06:00:02.567890123Z","level":"INFO","msg":"worker stderr","log":"INFO:nbl_cisco_nexus_dashboard.nexus_dashboard_diode:Fetched 4 switches for fabric 'evpn-lab'"}
{"time":"2026-09-10T06:00:03.678901234Z","level":"INFO","msg":"worker stderr","log":"INFO:nbl_cisco_nexus_dashboard.nexus_dashboard_diode:Fetched 1 VRFs for fabric 'evpn-lab'"}
{"time":"2026-09-10T06:00:03.789012345Z","level":"INFO","msg":"worker stderr","log":"INFO:nbl_cisco_nexus_dashboard.nexus_dashboard_diode:Fetched 3 networks for fabric 'evpn-lab'"}
{"time":"2026-09-10T06:00:05.890123456Z","level":"INFO","msg":"worker stderr","log":"INFO:worker.policy.runner:Policy cisco_nexus_dashboard_worker: Successfully ingested 312 entities in 1 chunks"}
{"time":"2026-09-10T06:00:05.901234567Z","level":"INFO","msg":"worker stderr","log":"INFO:apscheduler.executors.default:Job \"PolicyRunner.run (trigger: cron[month='*', day='*', day_of_week='*', hour='*/6', minute='0'], next run at: 2026-09-10 12:00:00 UTC)\" executed successfully"}
With API key authentication, the second line ends via API key instead of via username/password.
Monitoring and Testing
Success indicator: Look for Successfully ingested in the output to confirm data was sent to your NetBox instance via Diode.
Testing: Run the agent once and press Ctrl+C to stop it after seeing executed successfully. This lets you verify configuration before setting up continuous scheduled operation.
Continuous operation: The agent runs according to your cron schedule until the container is stopped.
View and Apply Discovered Data in NetBox Assurance
After the agent runs, work with the discovered Nexus Dashboard data in NetBox Assurance.
NetBox Assurance gives you control over operational drift by identifying deviations between your operational state and NetBox, and analytics to understand drift, plan for remediation, and ultimately take action.
Understanding Deviations
Deviations are the delta between the data already in NetBox as the Network Source of Truth, versus the actual operational state as discovered by the integration.
From an initial run, all discovered data may appear as deviations since it did not previously exist in NetBox. Once the initial sync is applied, subsequent runs surface only new or changed data.
Accessing NetBox Assurance
- Navigate to your NetBox instance.
- Click on Assurance in the main navigation menu.
Explore Deviation Types
- Click on Deviation Types to view the types of deviations discovered.
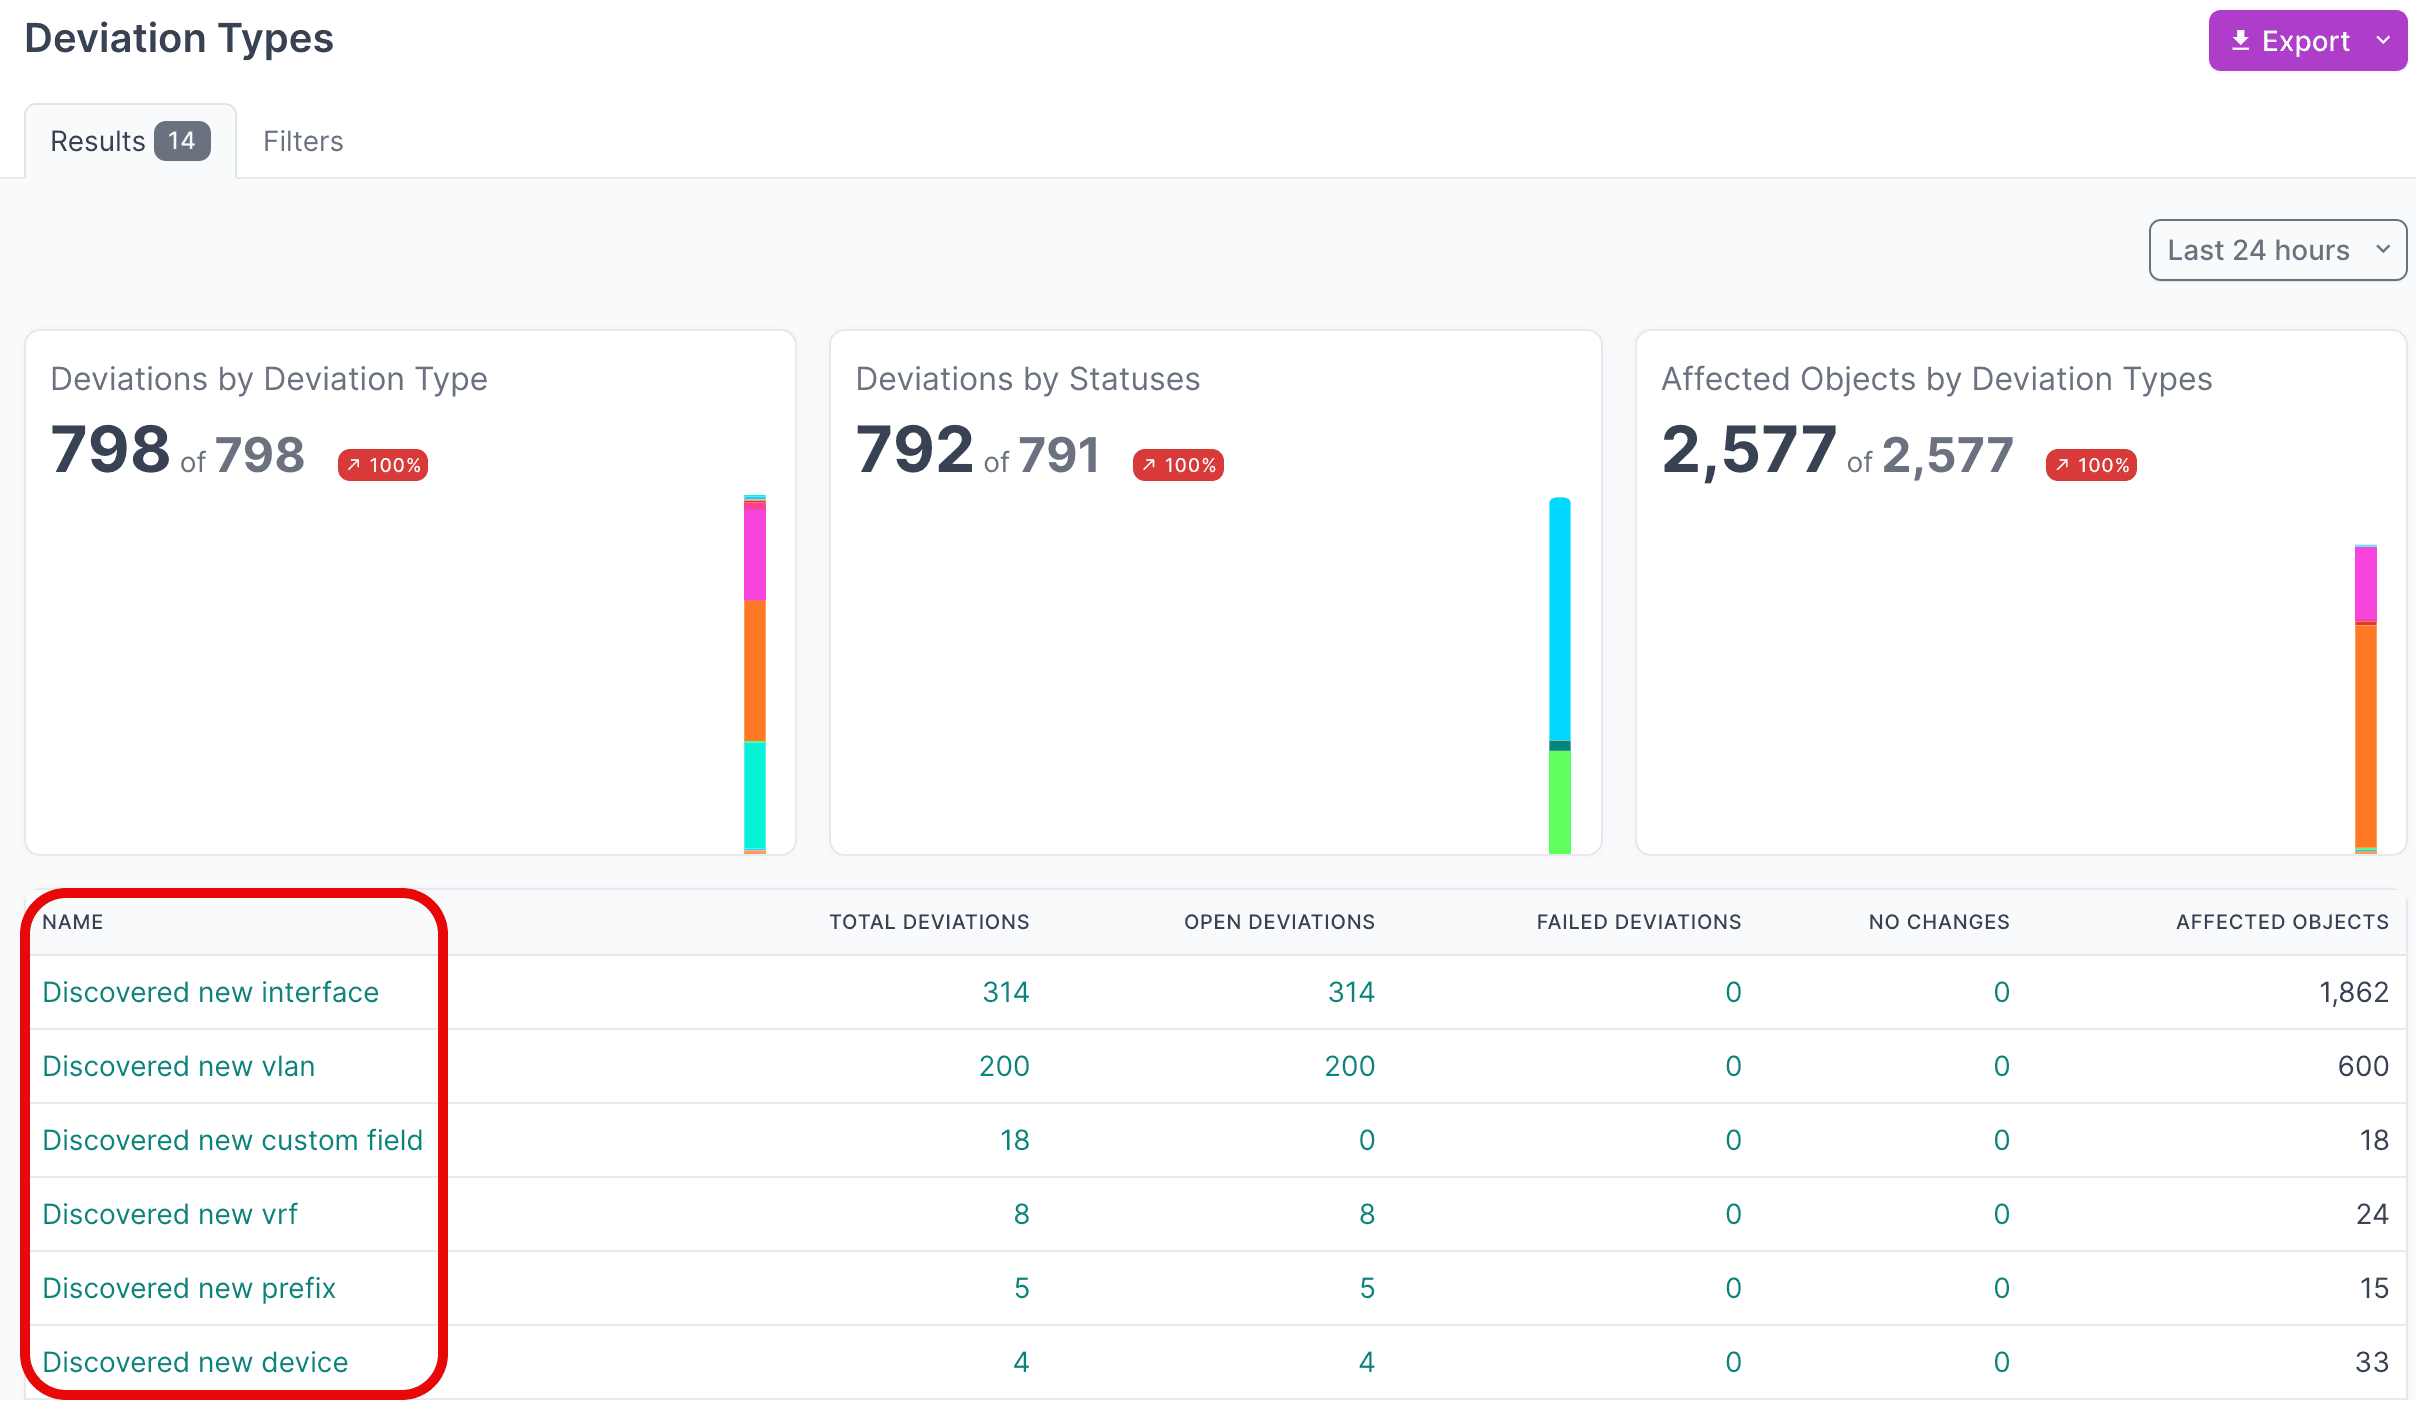
- Click the Name of a deviation type to view deviations of that type.
- Click the Name of an individual deviation to view its details.
View Active Deviations
- Click on Active Deviations to view all deviations that have not yet been applied or ignored.
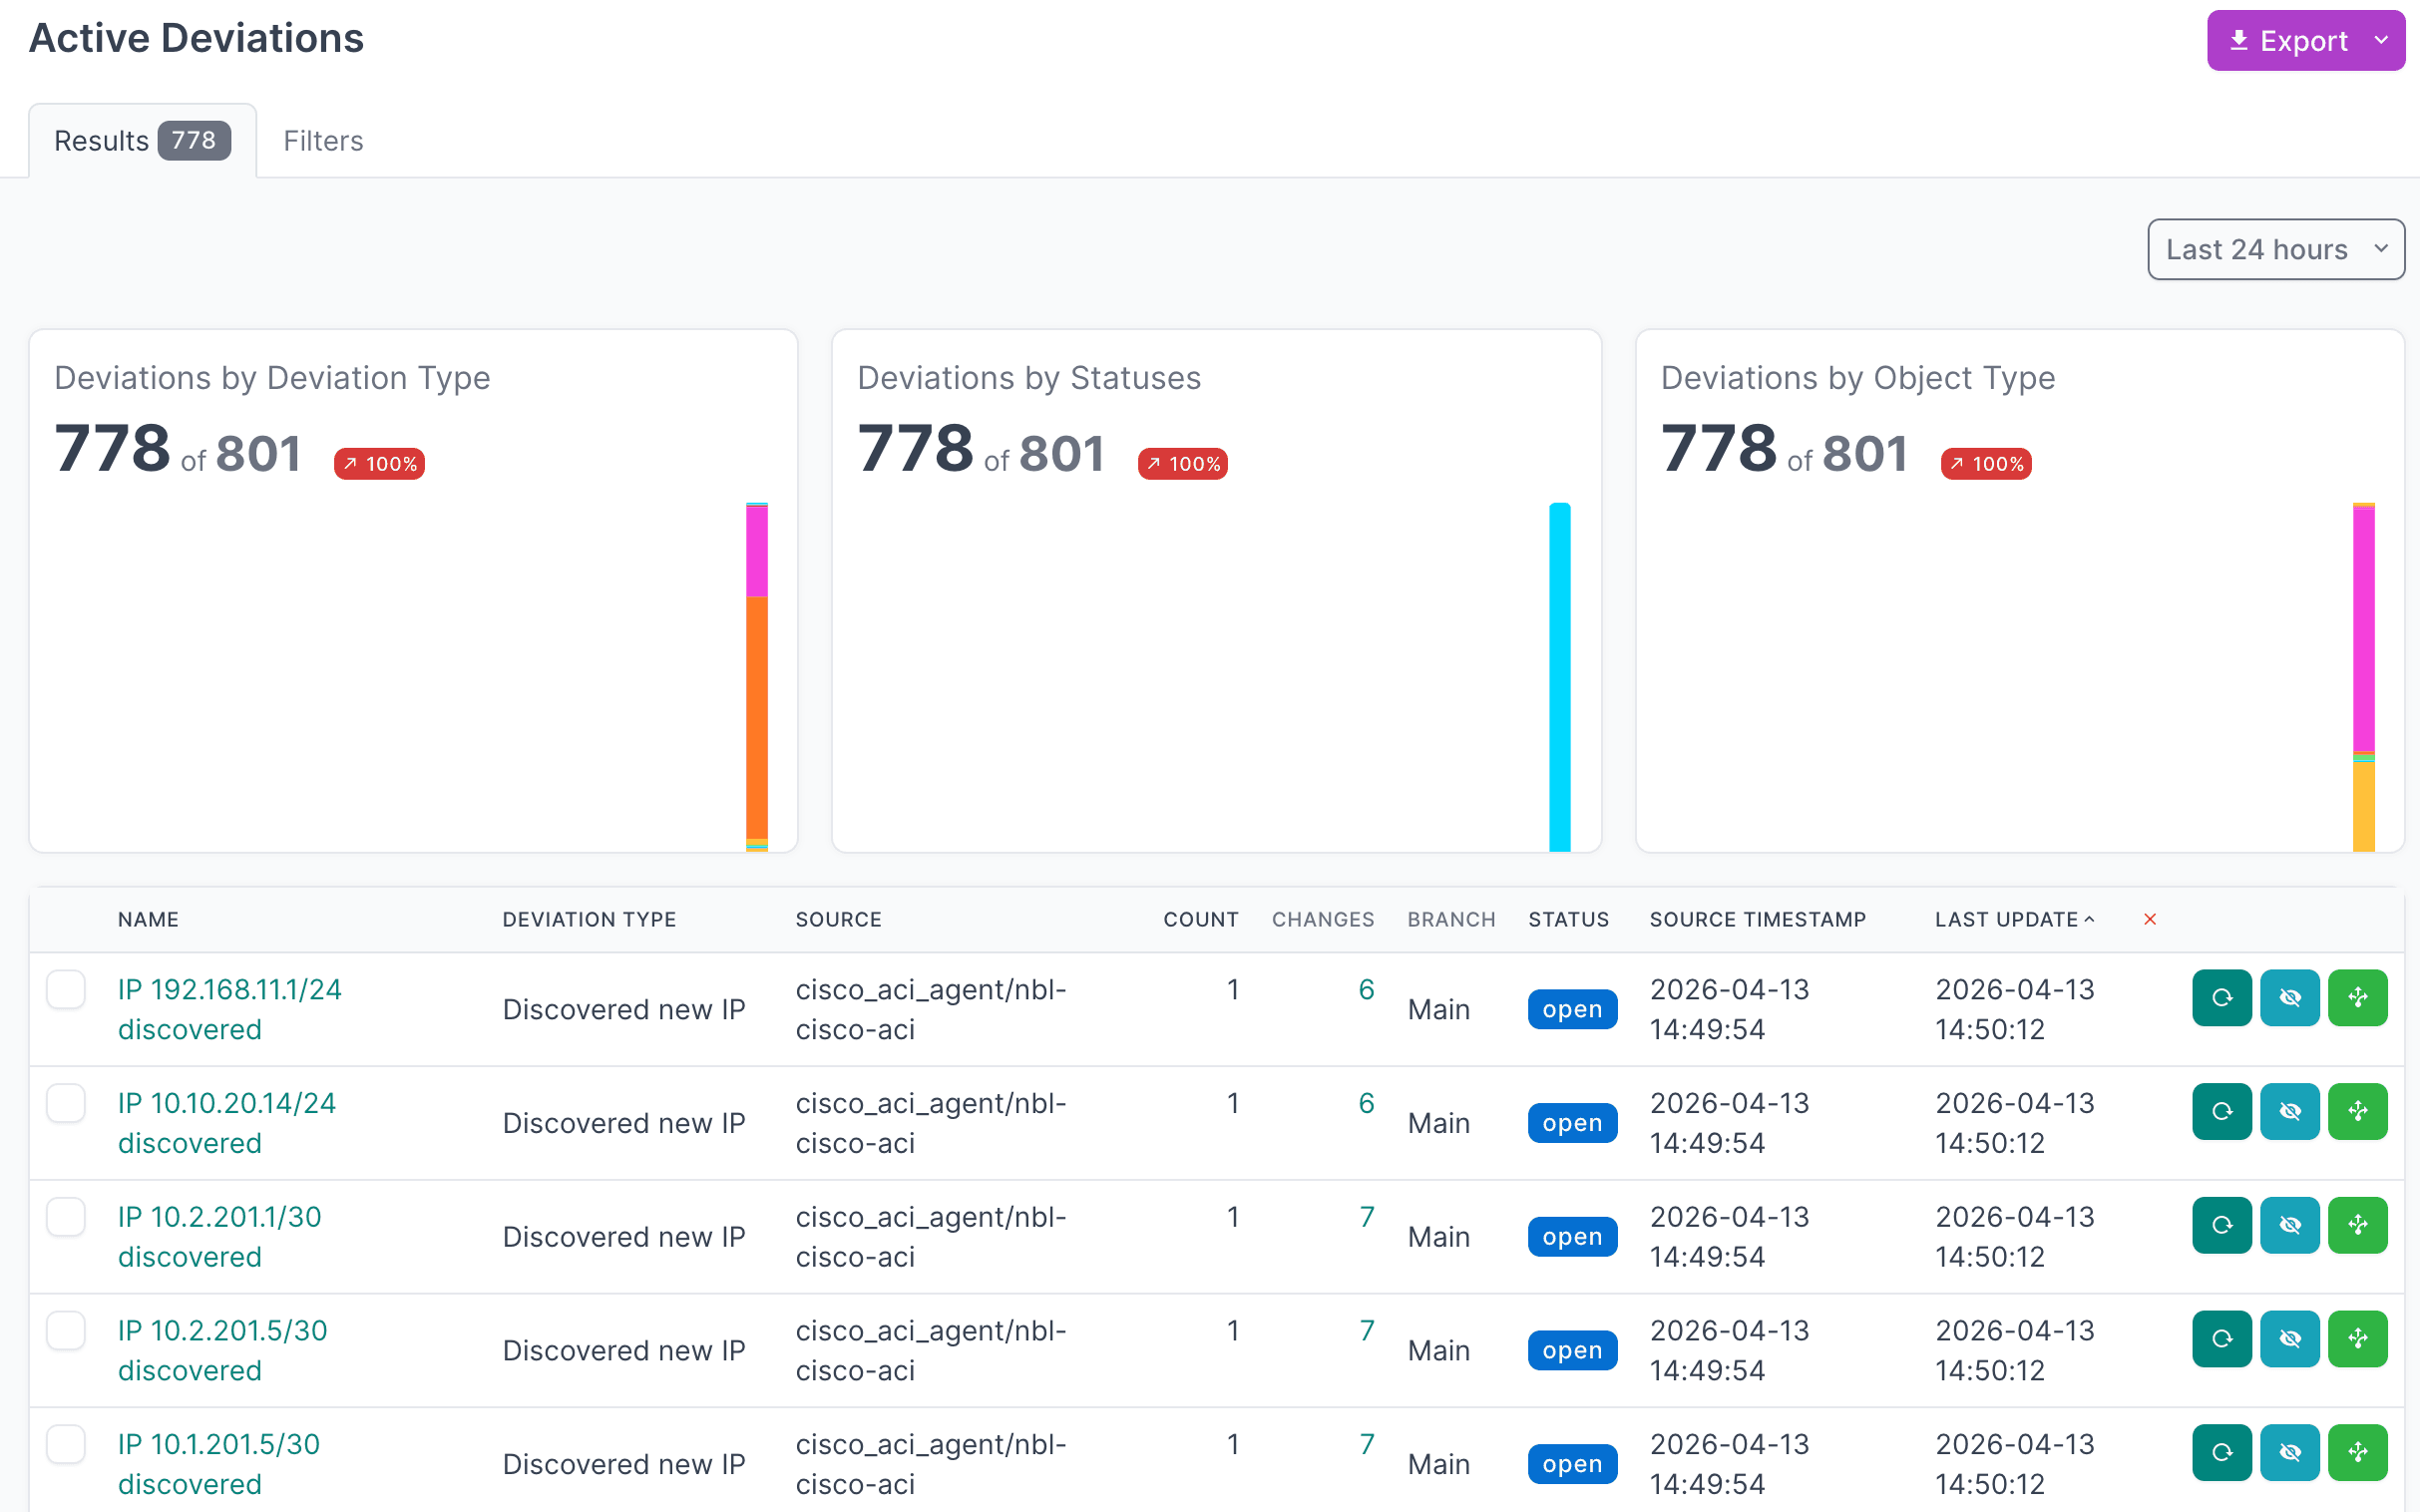
- Click the Name of a deviation to view its details.
Apply Deviations
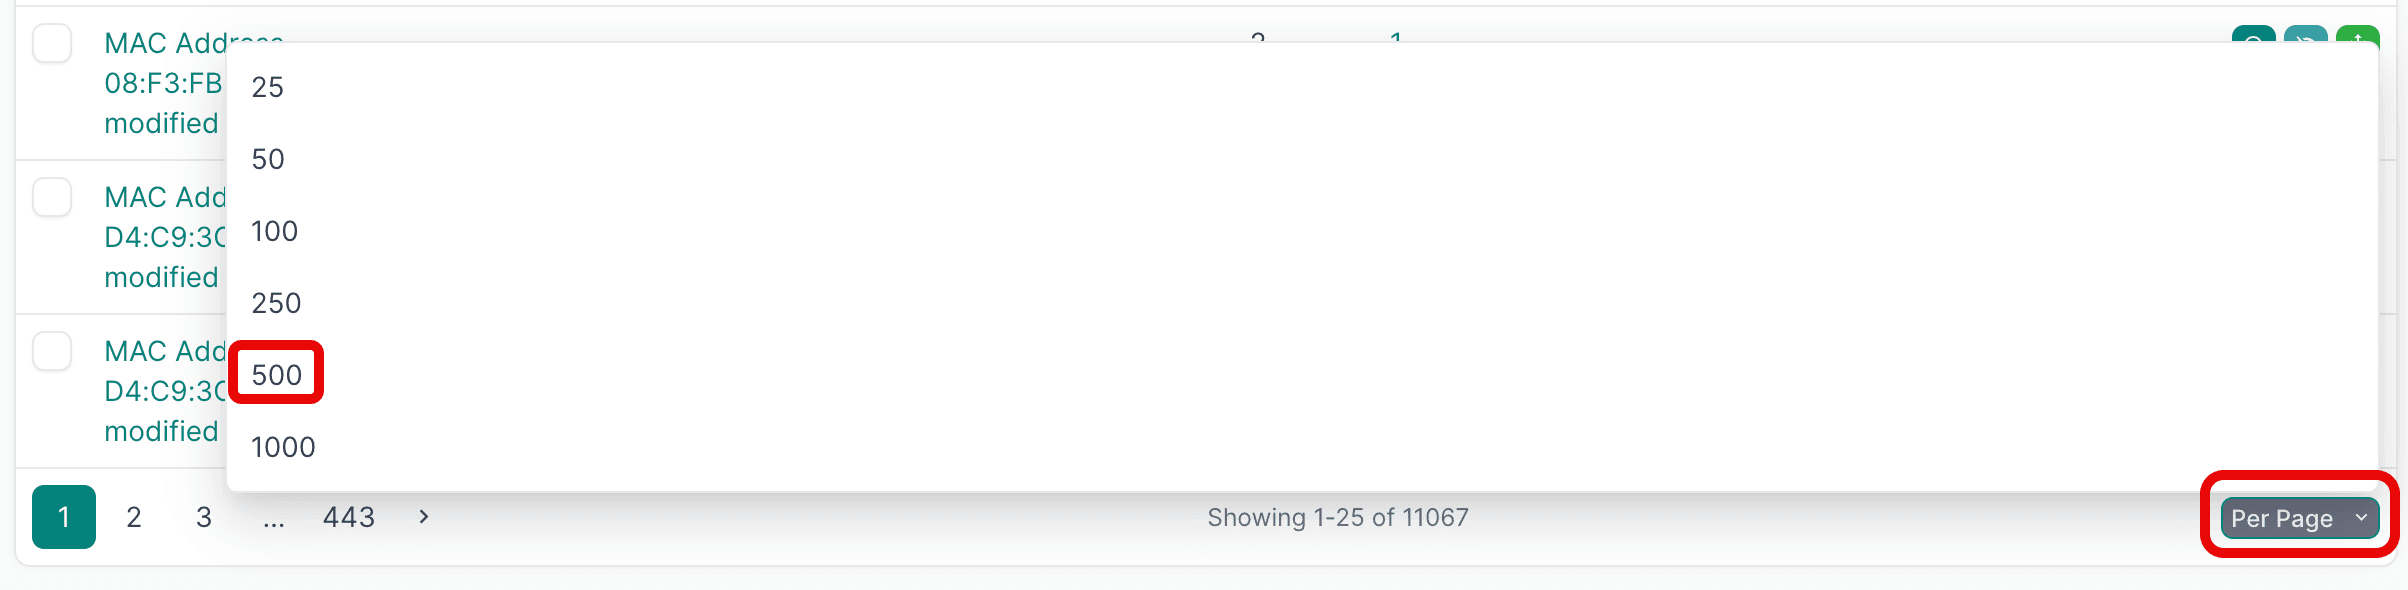
- Select the deviations you want to apply. For large result sets, set Per Page to 500 first.
- Select the first deviation, hold
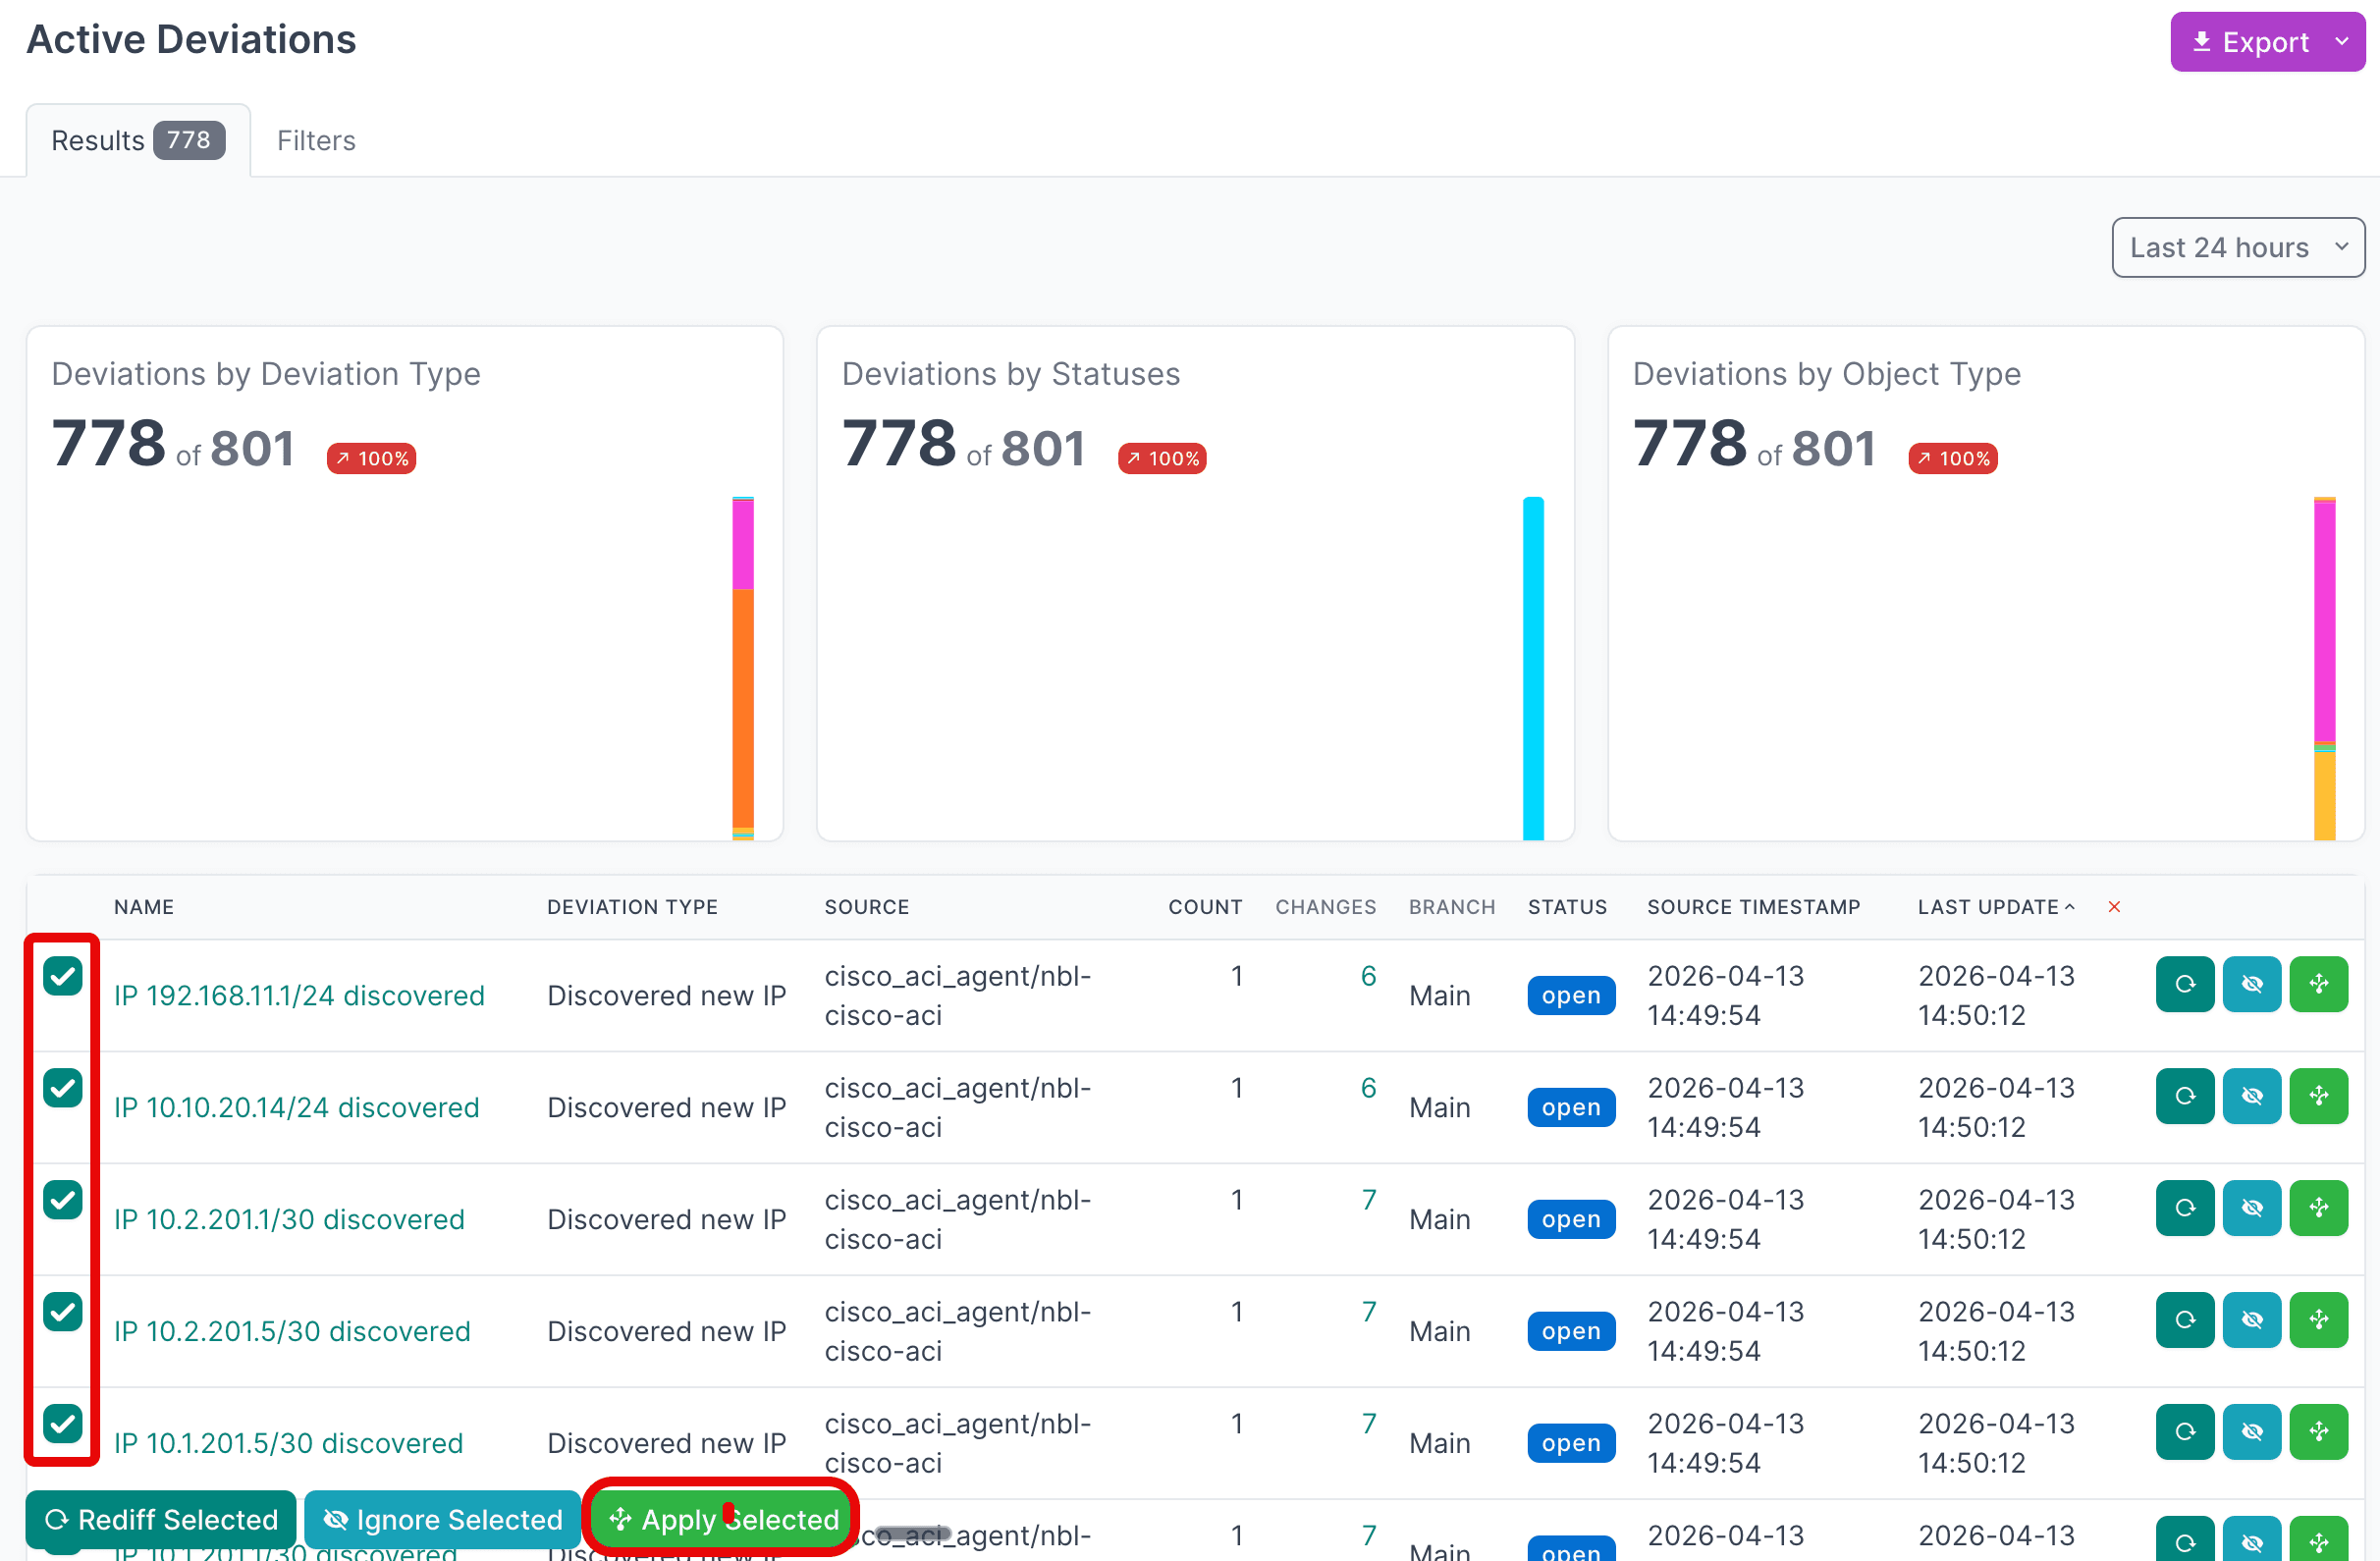
SHIFT, select the last one, then click Apply Selected.
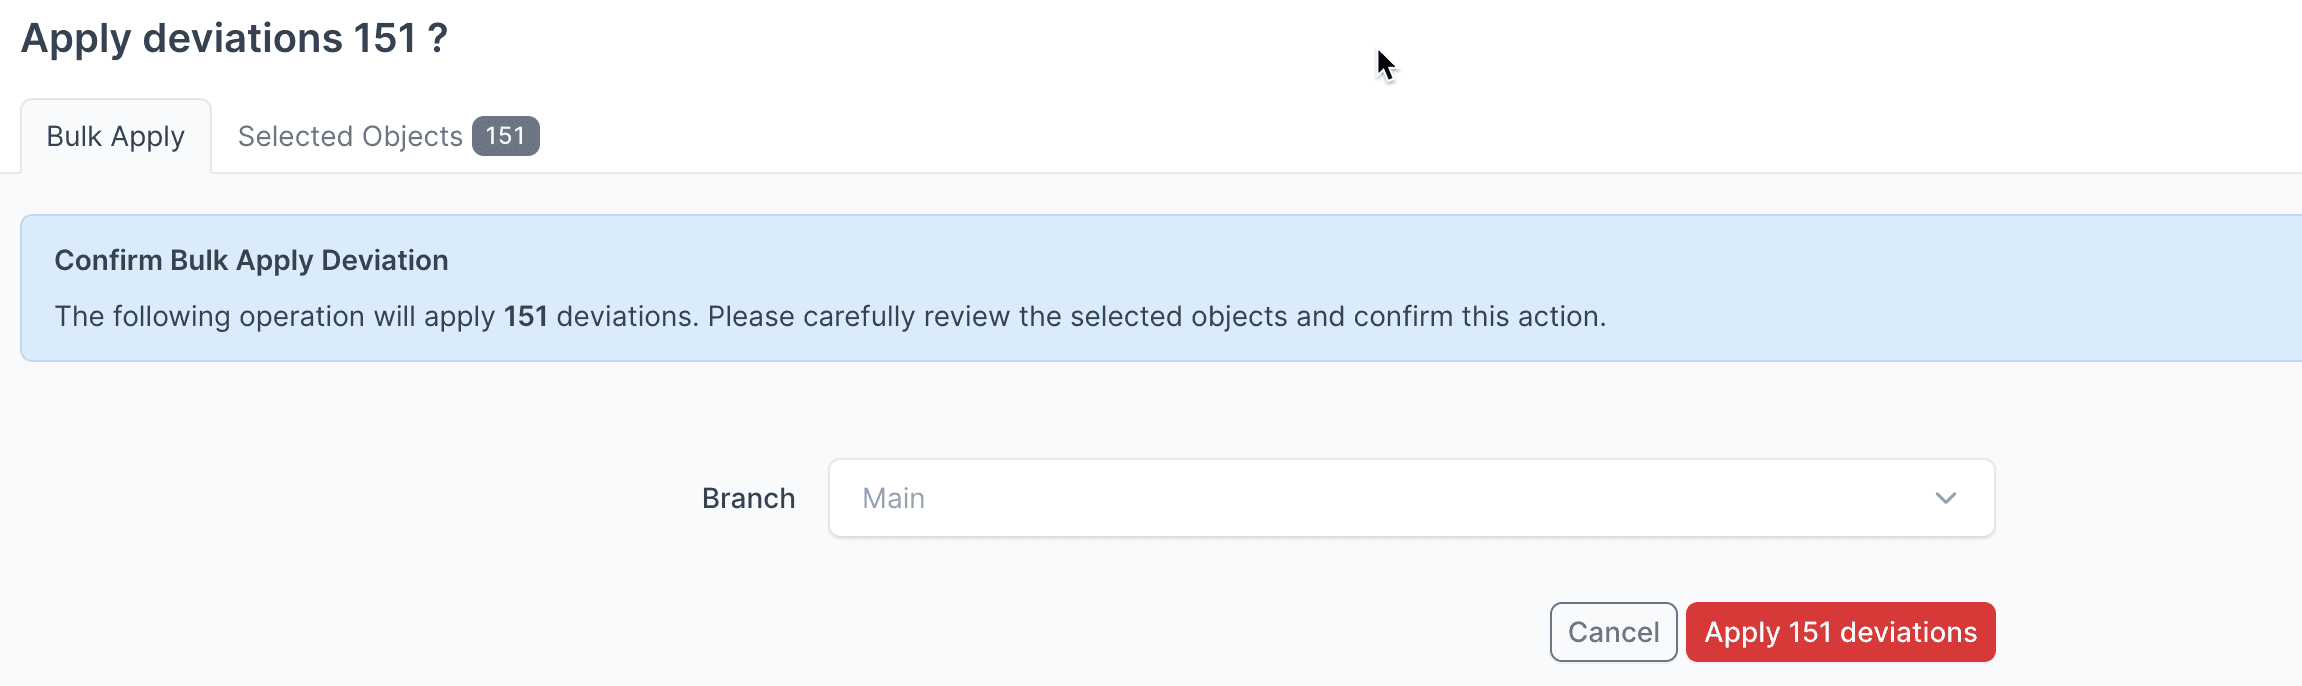
- Click Apply X Deviations to write the data to NetBox.
Apply Deviations to a Branch
Instead of writing deviations to the Main NetBox database branch, select another branch from the drop-down menu to apply deviations to that branch first.
Assurance Docs
For detailed information on working with NetBox Assurance, see the documentation.
View the Nexus Dashboard Data in NetBox
After running the integration and applying the discovered data, you can navigate the fabric inventory in NetBox.
- Navigate to Organization → Sites to view a site for each discovered fabric.
- Navigate to Devices → Devices to view the discovered fabric switches, with their device type, platform, role, site, and primary IP.
- Click a device to see its interfaces, its serial number, its NX-OS platform, and the
nd_switch_db_idcustom field value.
- Navigate to IPAM → VRFs to view the fabric VRFs and their route distinguishers.
- Navigate to IPAM → VLANs to view the overlay networks, each carrying its VXLAN VNI in the
nd_segment_idcustom field.
- Navigate to IPAM → Prefixes and IPAM → IP Addresses to view the overlay gateway subnets and the management, loopback, routed interface, and anycast gateway addresses.
Filtering by Tag
Filter any NetBox list by the nexus-dashboard tag to view all objects created by the integration, or by the nd-{host} tag (for example nd-nd.example.com) to view objects from a specific Nexus Dashboard cluster.
Additional Resources
Related Documentation
- NetBox Assurance Documentation
- Orb Agent Documentation
- Cisco Nexus Dashboard Integration - Technical Information
- Cisco Nexus Dashboard Integration - FAQ & Troubleshooting
Support
Email support@netboxlabs.com for support.
Cisco Nexus Dashboard Integration
Discover and synchronize NX-OS VXLAN/EVPN fabric inventory from Cisco Nexus Dashboard - switches, interfaces, VRFs, overlay VLANs, prefixes, and IP addresses - into NetBox via the Diode SDK. Currently in public preview.
Technical Information
Cisco Nexus Dashboard to NetBox object and attribute mappings, configuration and scope reference, authentication, tags, and behavior notes for the Cisco Nexus Dashboard integration.