Core Concepts
This page covers the mental model for NetBox Validation -- the objects you'll work with and how they relate.
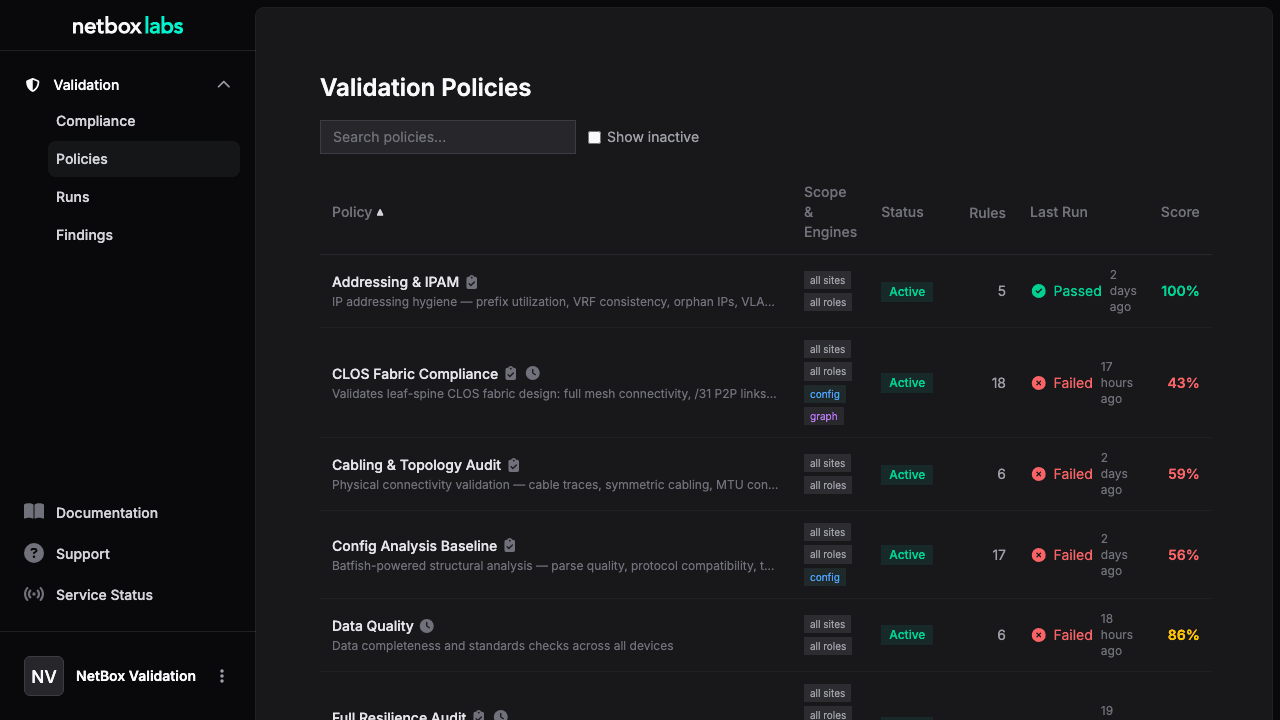
Policies
A Validation Policy defines what to validate and where. Policies scope devices using:
- Sites / Regions / Site Groups -- geographic targeting
- Device Roles -- e.g., only leaf switches, only firewalls
- Platforms -- e.g., only Arista EOS
- Device Tags -- e.g., only devices tagged "production"
A policy contains one or more rules and controls:
- Whether the config engine and/or graph engine are enabled for that policy
- Whether to trigger automatically on branch merge or change request submission
- A cron schedule for periodic automated runs
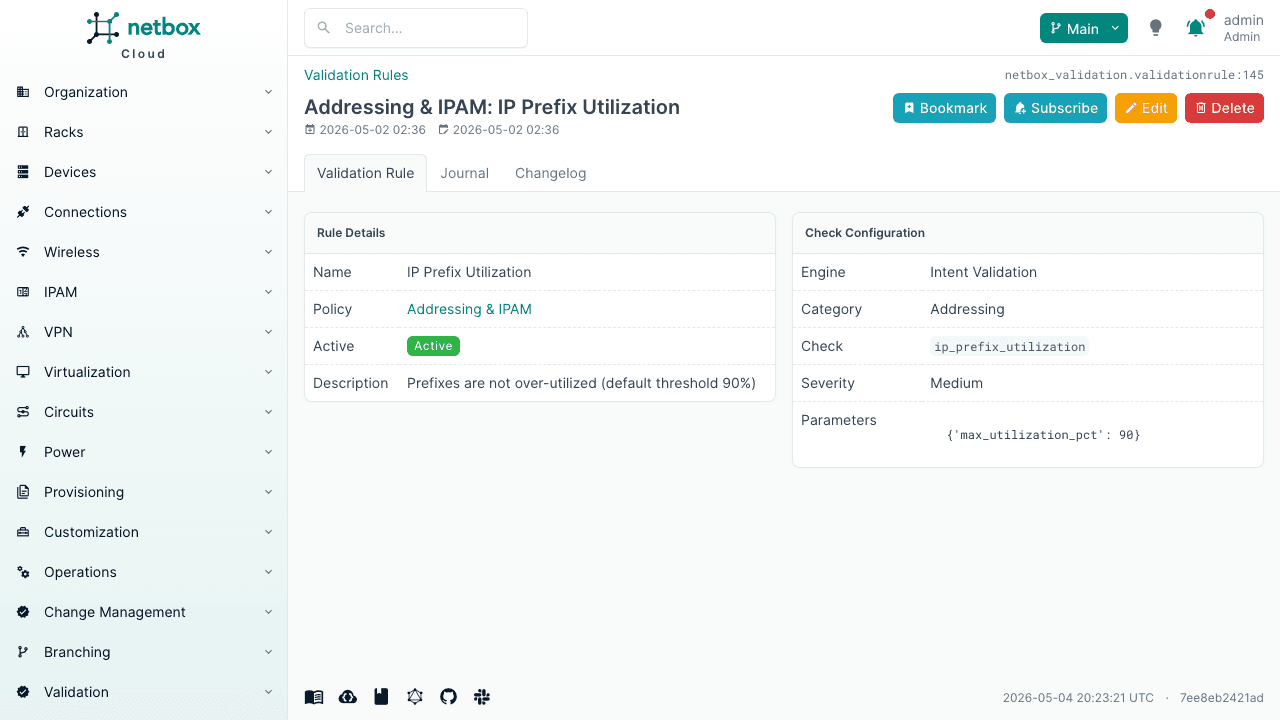
Rules
A Validation Rule is a single check within a policy. Each rule specifies:
| Field | Description |
|---|---|
engine | intent, config, or graph |
category | Check grouping (addressing, redundancy, topology, standards, etc.) |
check_name | The specific check to run (e.g., no_duplicate_ips) |
severity | critical, high, medium, low, or info |
parameters | Check-specific configuration (thresholds, patterns, expected values) |
Rules can optionally override the policy's device scope with their own roles and platforms filters.
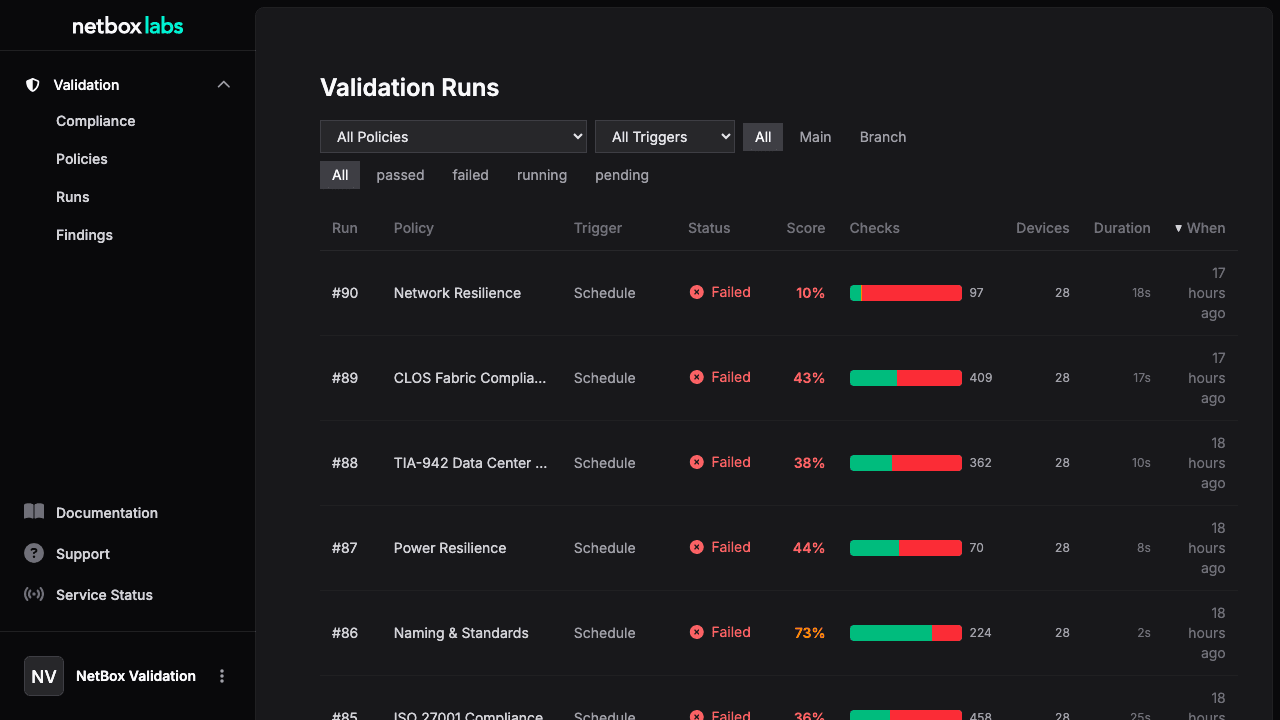
Runs
A Validation Run executes all active rules in a policy against matching devices. Runs can be:
- Manual -- triggered via UI ("Run Now") or API
- Automatic -- triggered on branch merge or change request submission
- Scheduled -- recurring via cron expression on the policy
Runs optionally support target scoping -- narrowing the policy's device scope to specific sites, devices, or tags for that run only. Target fields are AND-combined with the policy scope (they can only narrow, never widen). An empty target means the full policy scope is used.
The runs list is scoped to the active branch context -- when viewing Main, you see main-context runs; when viewing a branch, you see only that branch's runs.
Run Status
| Status | Meaning |
|---|---|
pending | Created, waiting for execution |
running | Checks are executing |
passed | All checks passed (no failures or errors) |
failed | One or more checks failed |
error | Engine error during execution |
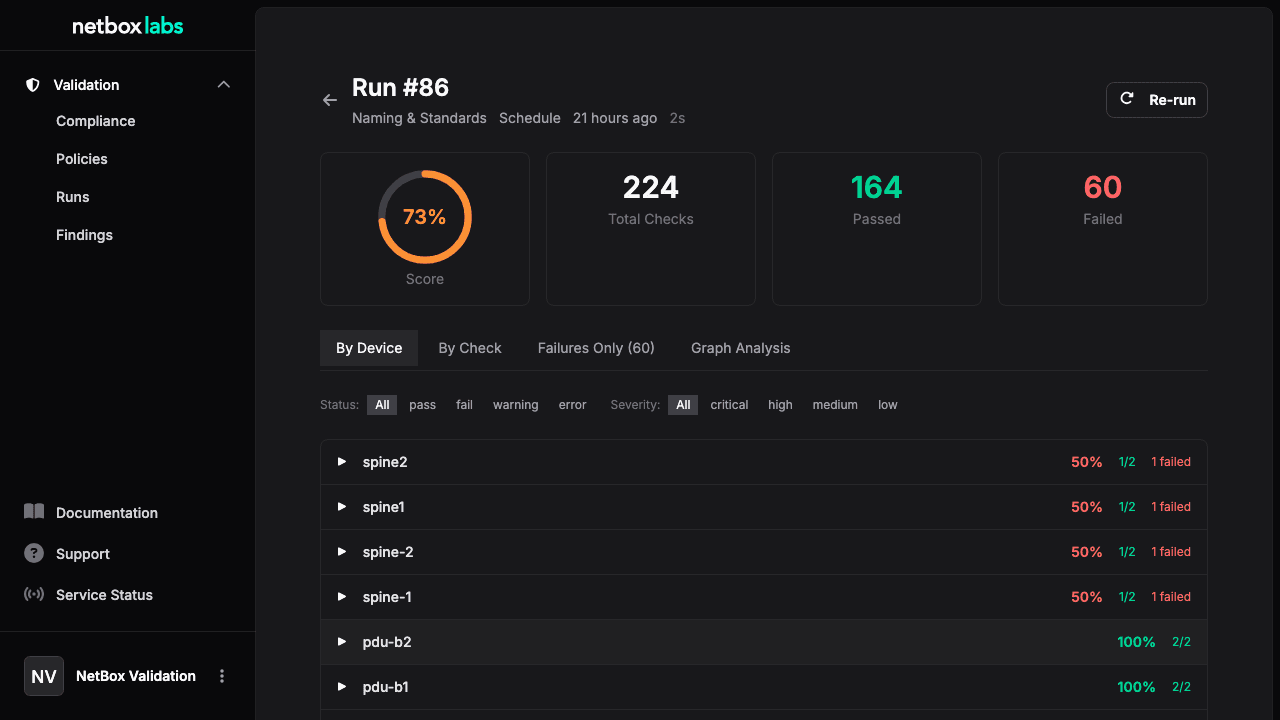
Results
Results are per-device, per-check outcomes. Each result includes:
| Field | Description |
|---|---|
status | pass, fail, skip, warning, or error |
severity | Inherited from the rule |
message | Human-readable description |
expected | What the check expected |
actual | What was found |
remediation | Suggested fix |
extra | Structured metadata (engine-specific details) |
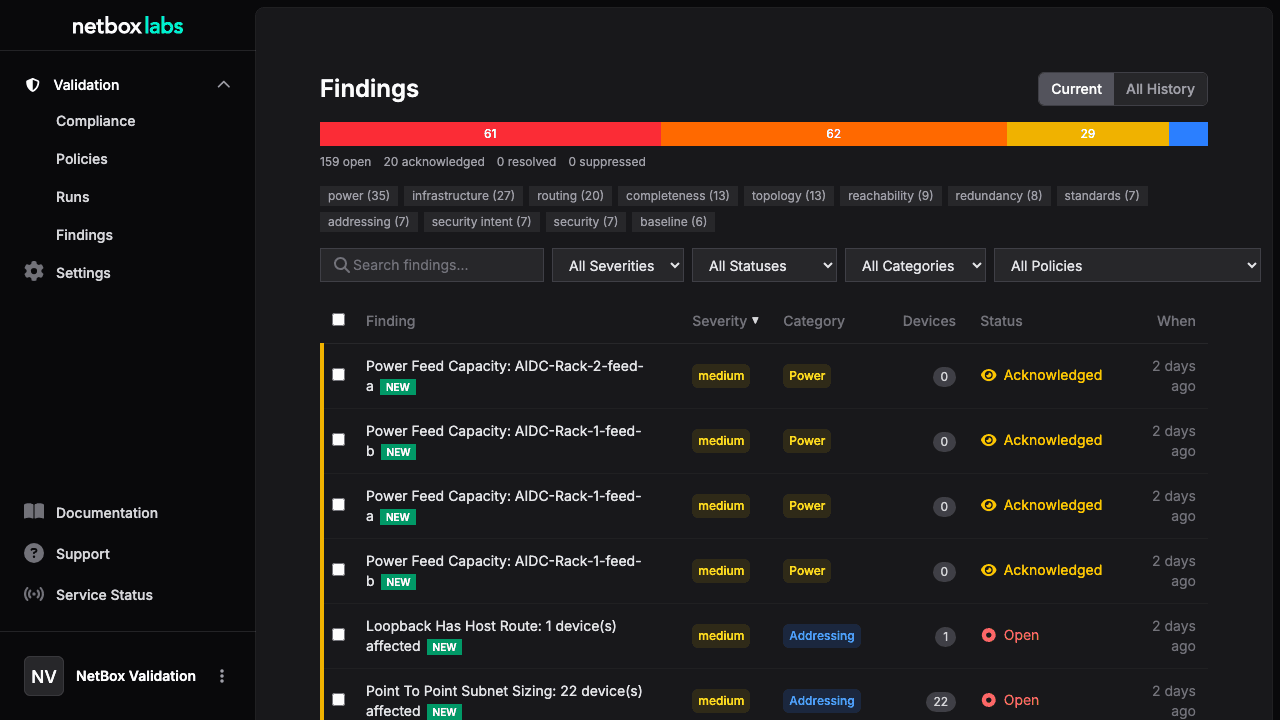
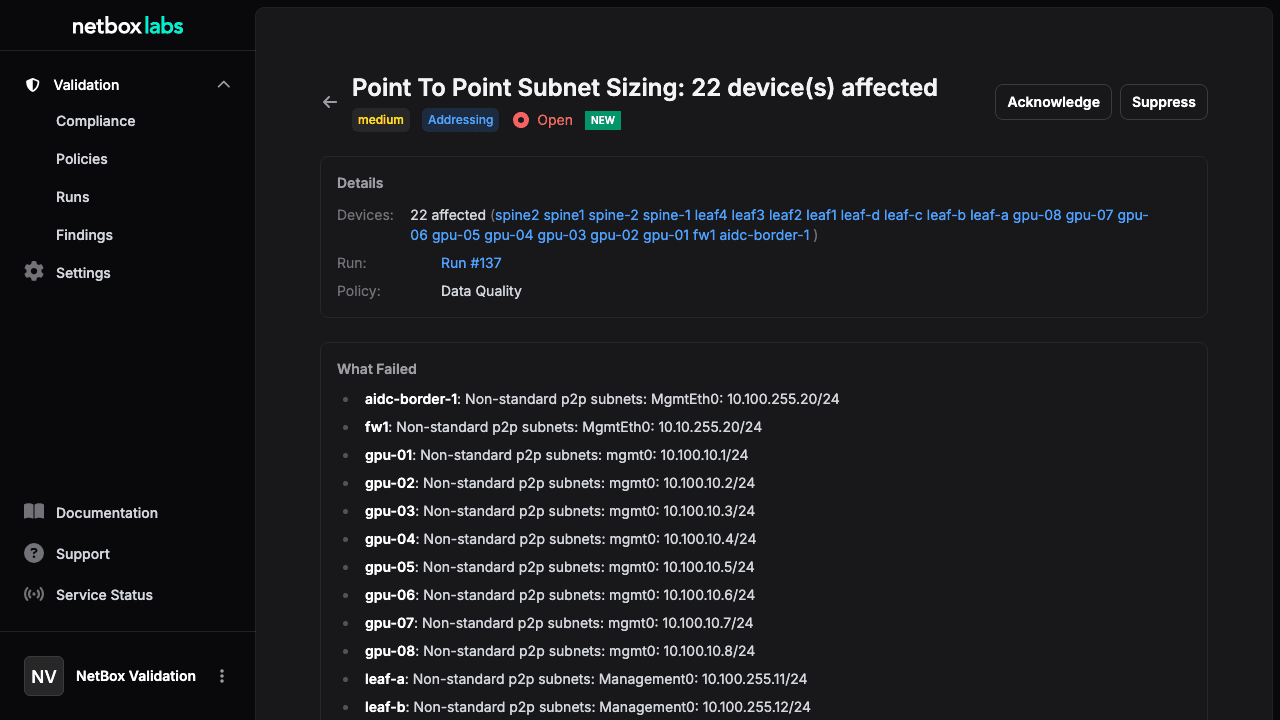
Findings
Findings aggregate related failures into actionable items. For example, if no_duplicate_ips fails for 5 devices, one finding is created grouping all 5. Graph engine findings group by failure point (e.g., one finding per power feed or per shared failure domain).
Each finding is tracked by a stable finding key that identifies the unique issue (e.g., the check name, or check name + failure point for graph findings). This key is used to track findings across runs within the same policy:
- New findings (appearing for the first time) are flagged with a visual indicator
- Recurring findings show how many previous runs detected the same issue and when it was first seen
The findings list defaults to the Current view, showing only findings from the latest run of each policy. This eliminates historical duplication so you see each unique issue once. Use the search bar to filter by title, description, or remediation text.
Each finding has a lifecycle status:
| Status | Meaning |
|---|---|
open | New issue, needs attention |
acknowledged | Reviewed, work planned |
resolved | Fixed and verified |
suppressed | Intentionally ignored (known exception) |
Status can be changed via the finding detail page, or in bulk using the checkbox selection and action bar in the findings list. The API also supports bulk status updates.
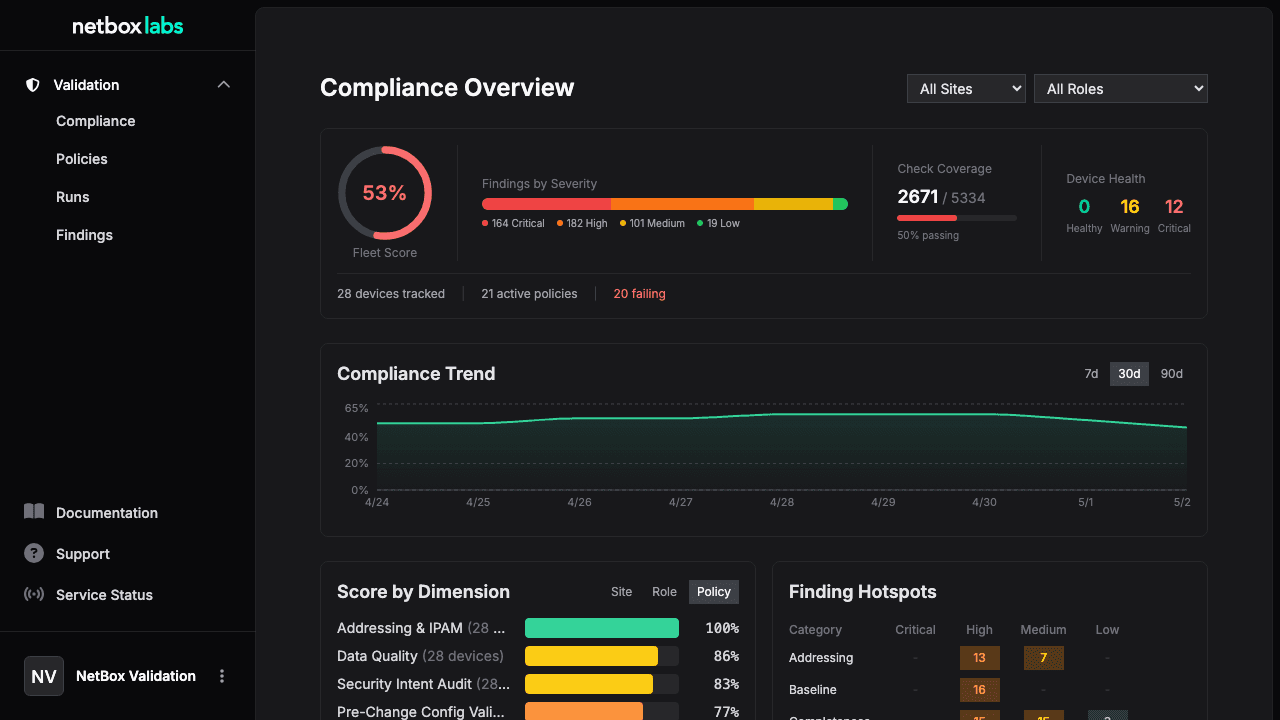
Compliance Scores
After each run, a compliance score (0--100%) is calculated per device per policy:
score = (passed_checks / (passed_checks + failed_checks + error_checks)) x 100Skipped checks are excluded from the calculation.
Scores enable:
- Trend tracking -- monitor compliance over time via the compliance dashboard
- Audit reporting -- export scores for compliance evidence
- Change request gating -- block merges when scores drop below a threshold
- Executive dashboards -- fleet-wide compliance visibility
Engines Overview
NetBox Validation uses three engines, each evaluating different aspects of infrastructure compliance:
| Engine | What It Evaluates | Data Source | Key Strength |
|---|---|---|---|
| Intent | NetBox data relationships | NetBox data model | Fast, no external dependencies |
| Config | Rendered device configurations | Config analysis engine | Structural analysis, reachability |
| Graph | Infrastructure dependency graph | NetBox data model | Blast radius, failure domains |
All three can coexist in a single policy. See Engines for details.
Check Types
| Type | Count | Use Case |
|---|---|---|
| Built-in intent | 42 checks | Core compliance -- works out of the box |
| Built-in config | 35 checks | Structural safety -- requires config analysis engine |
| Built-in graph | 16 checks | Infrastructure resilience -- power, topology, blast radius |
| Declarative | User-defined | No-code query+assert patterns via rule parameters |
All types produce identical output -- same results, findings, and compliance scoring.
Data Flow
Policy (scope + rules)
    |
    v
Run (execute rules against devices)
    |
    v
Results (per-device, per-check pass/fail)
    |
    v
Findings (aggregated failures, actionable items)
    |
    v
Compliance Scores (per-device, per-policy, 0-100%)
What's Next
- Getting Started -- Walk through your first validation
- Workflows -- Pre-change validation, continuous compliance, finding management
- Engines -- Deep dive into intent, config, and graph engines
Getting Started
This tutorial walks you through your first validation -- from installing a policy pack to reviewing compliance scores. You'll have a working validation pipel...
Policy Pack Library
NetBox Validation ships with pre-built policy packs that you can install in one click. Starter packs cover common validation scenarios. Compliance framework ...